
|
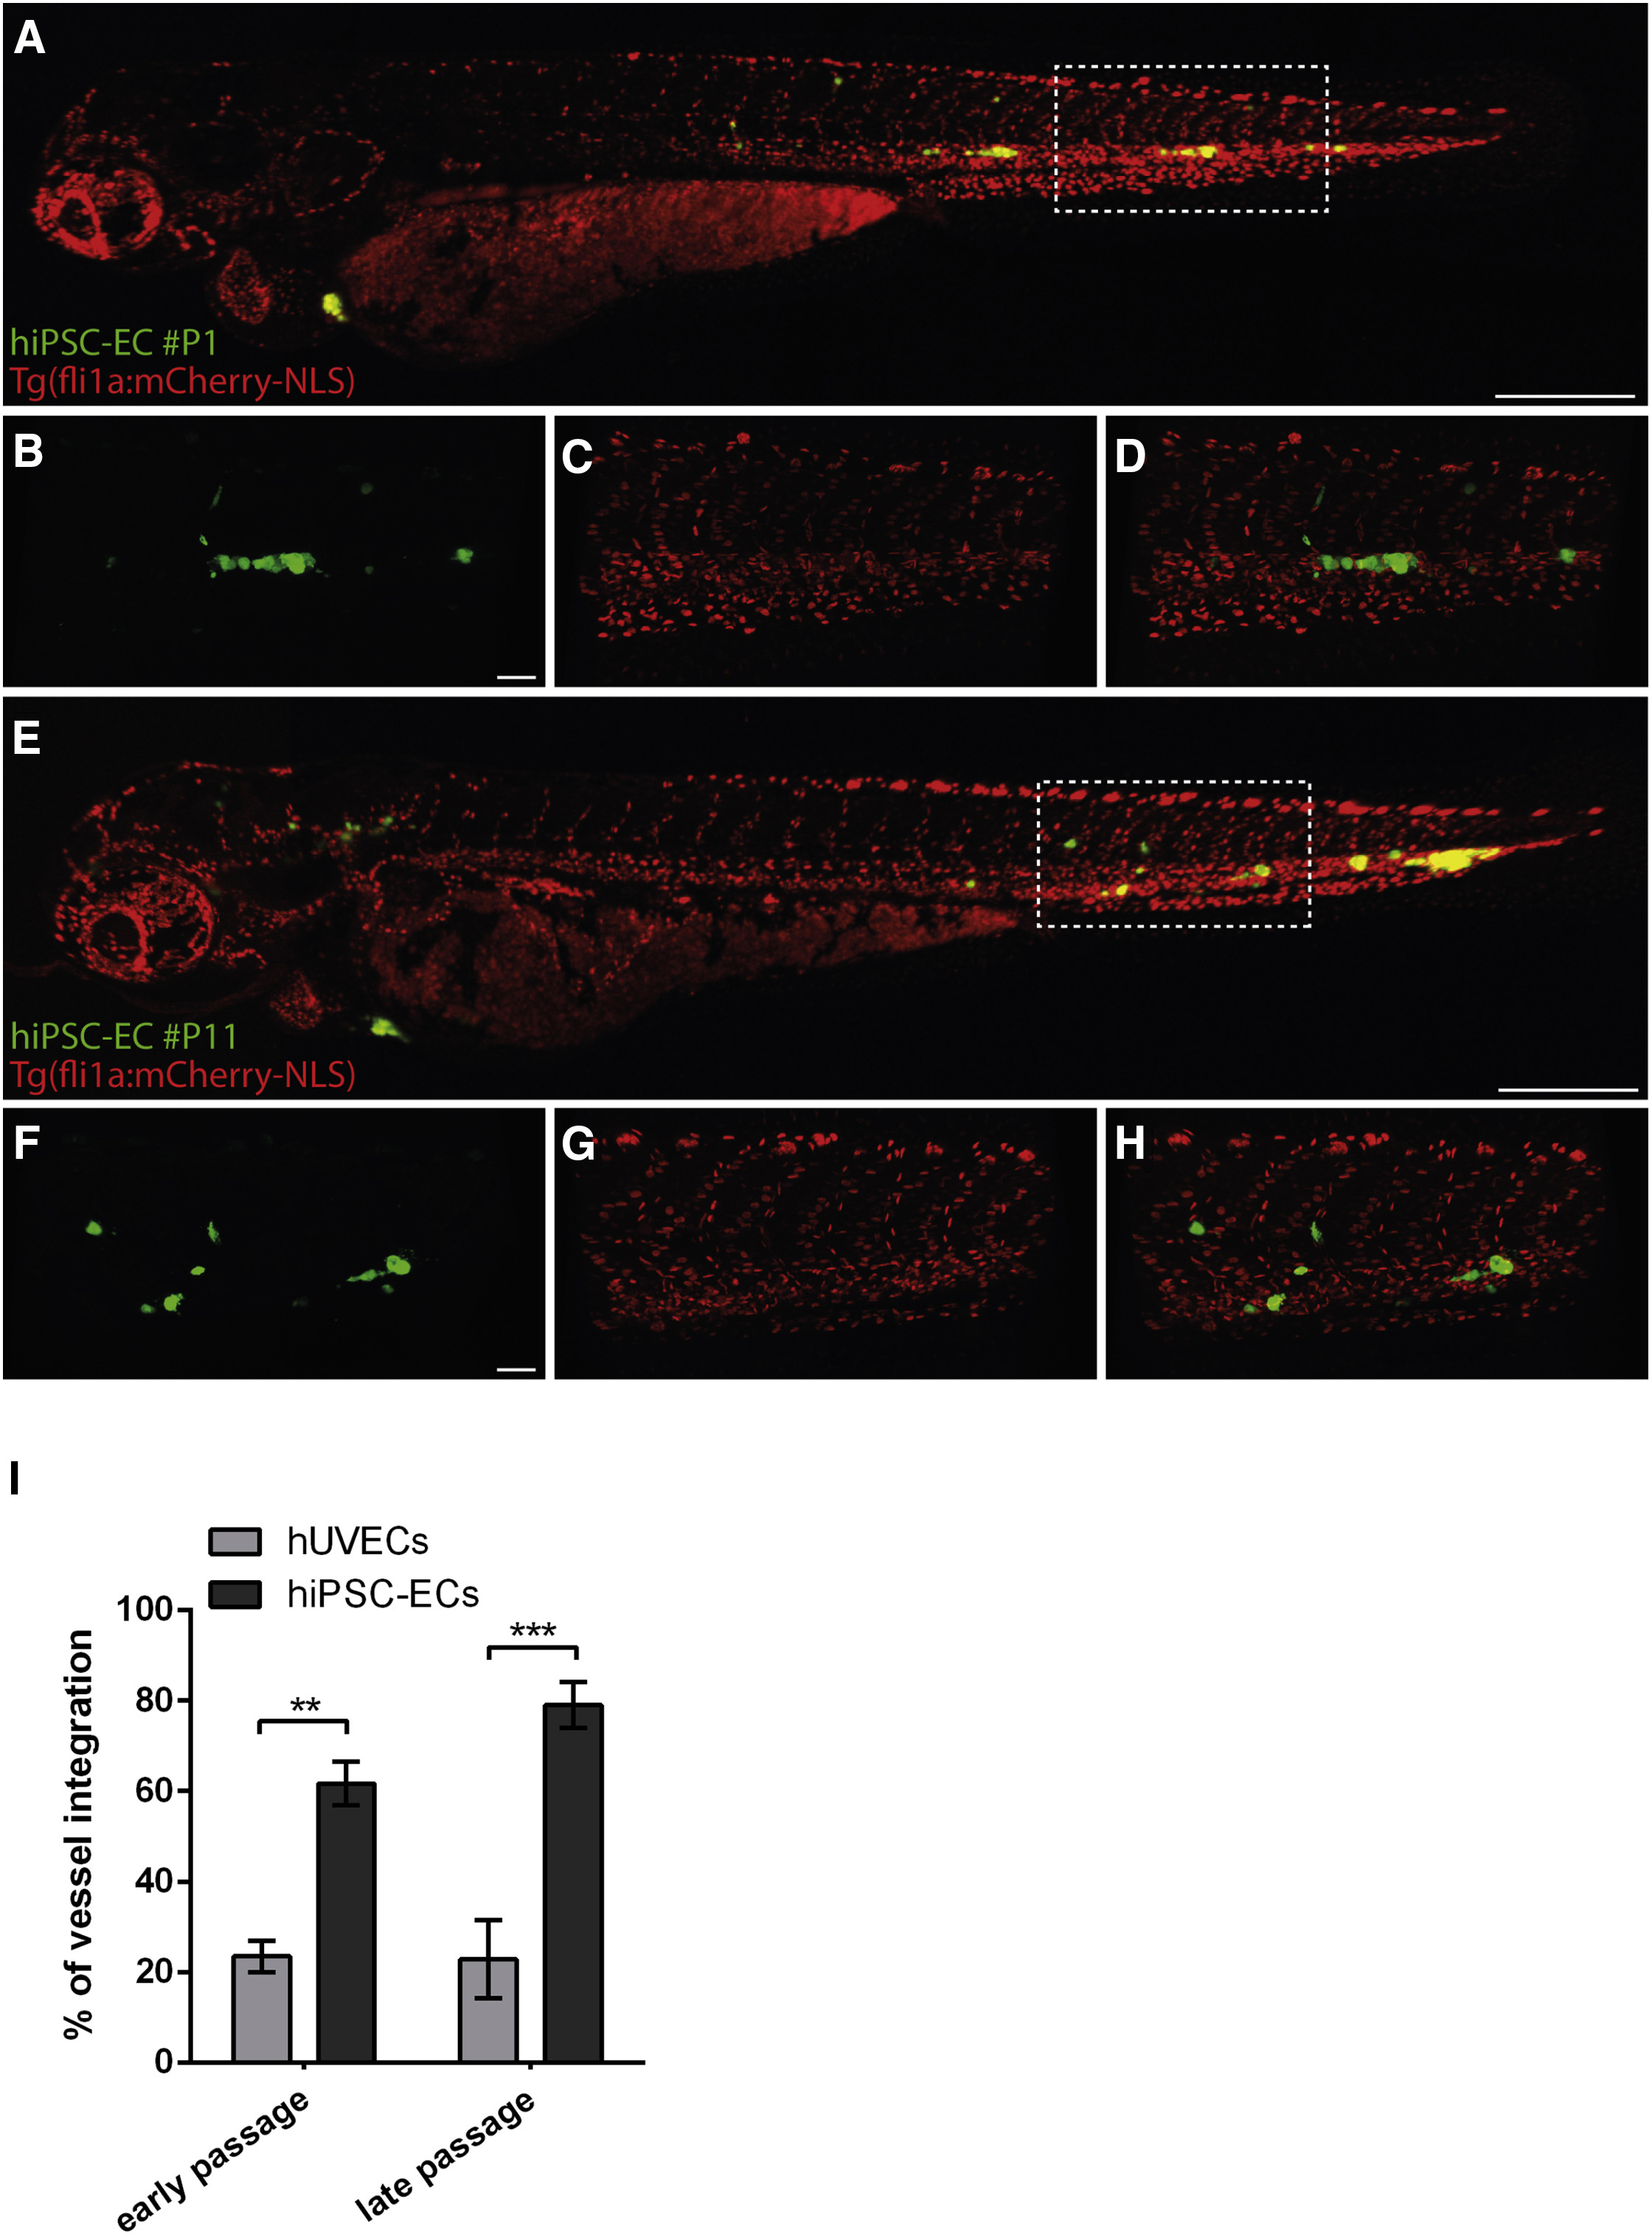
Fig. 6
Vascular Competence of Early and Late hiPSC-Derived EC Passages in a Zebrafish Xenograft Model
Early (P1) passage hiPSC-ECs (green, hCBiPSCAGeGFP) within the embryonic zebrafish vasculature [marked by Tg(fli1a:mCherry-NLS)ubs10, red)] 1 day after transplantation (A). Scale bar, 300 μm. Details of vessels with P1 hiPSC-EC (green) integration into the Tg(fli1a:mCherry-NLS)ubs10 transgenic embryonic zebrafish vasculature (red) (B–D). Scale bar, 50 μm. Late (P11) passage hiPSC-ECs (green) within the Tg(fli1a:mCherry-NLS)ubs10 transgenic embryonic zebrafish vasculature (red) 1 day after transplantation (E). Scale bar, 300 μm. Details of vessel with P11 hiPSC-EC (green) integration into the Tg(fli1a:mCherry-NLS)ubs10 transgenic embryonic zebrafish vasculature (red) (F–H). Scale bar, 50 μm. Quantification of integration rates of early and late hiPSC-ECs compared with early (P1, P4, and P5) and late (P14) hUVECs into the zebrafish embryonic vasculature 1 day after transplantation. Integration rates into the zebrafish vasculature were 61.9% (n = 83/134 embryos) for early hiPSC-ECs and 78.3% (n = 112/143 embryos) for late hiPSC-ECs. ∗∗p ≤ 0.01, ∗∗∗p ≤ 0.001 (I).