
|
Fig. 2
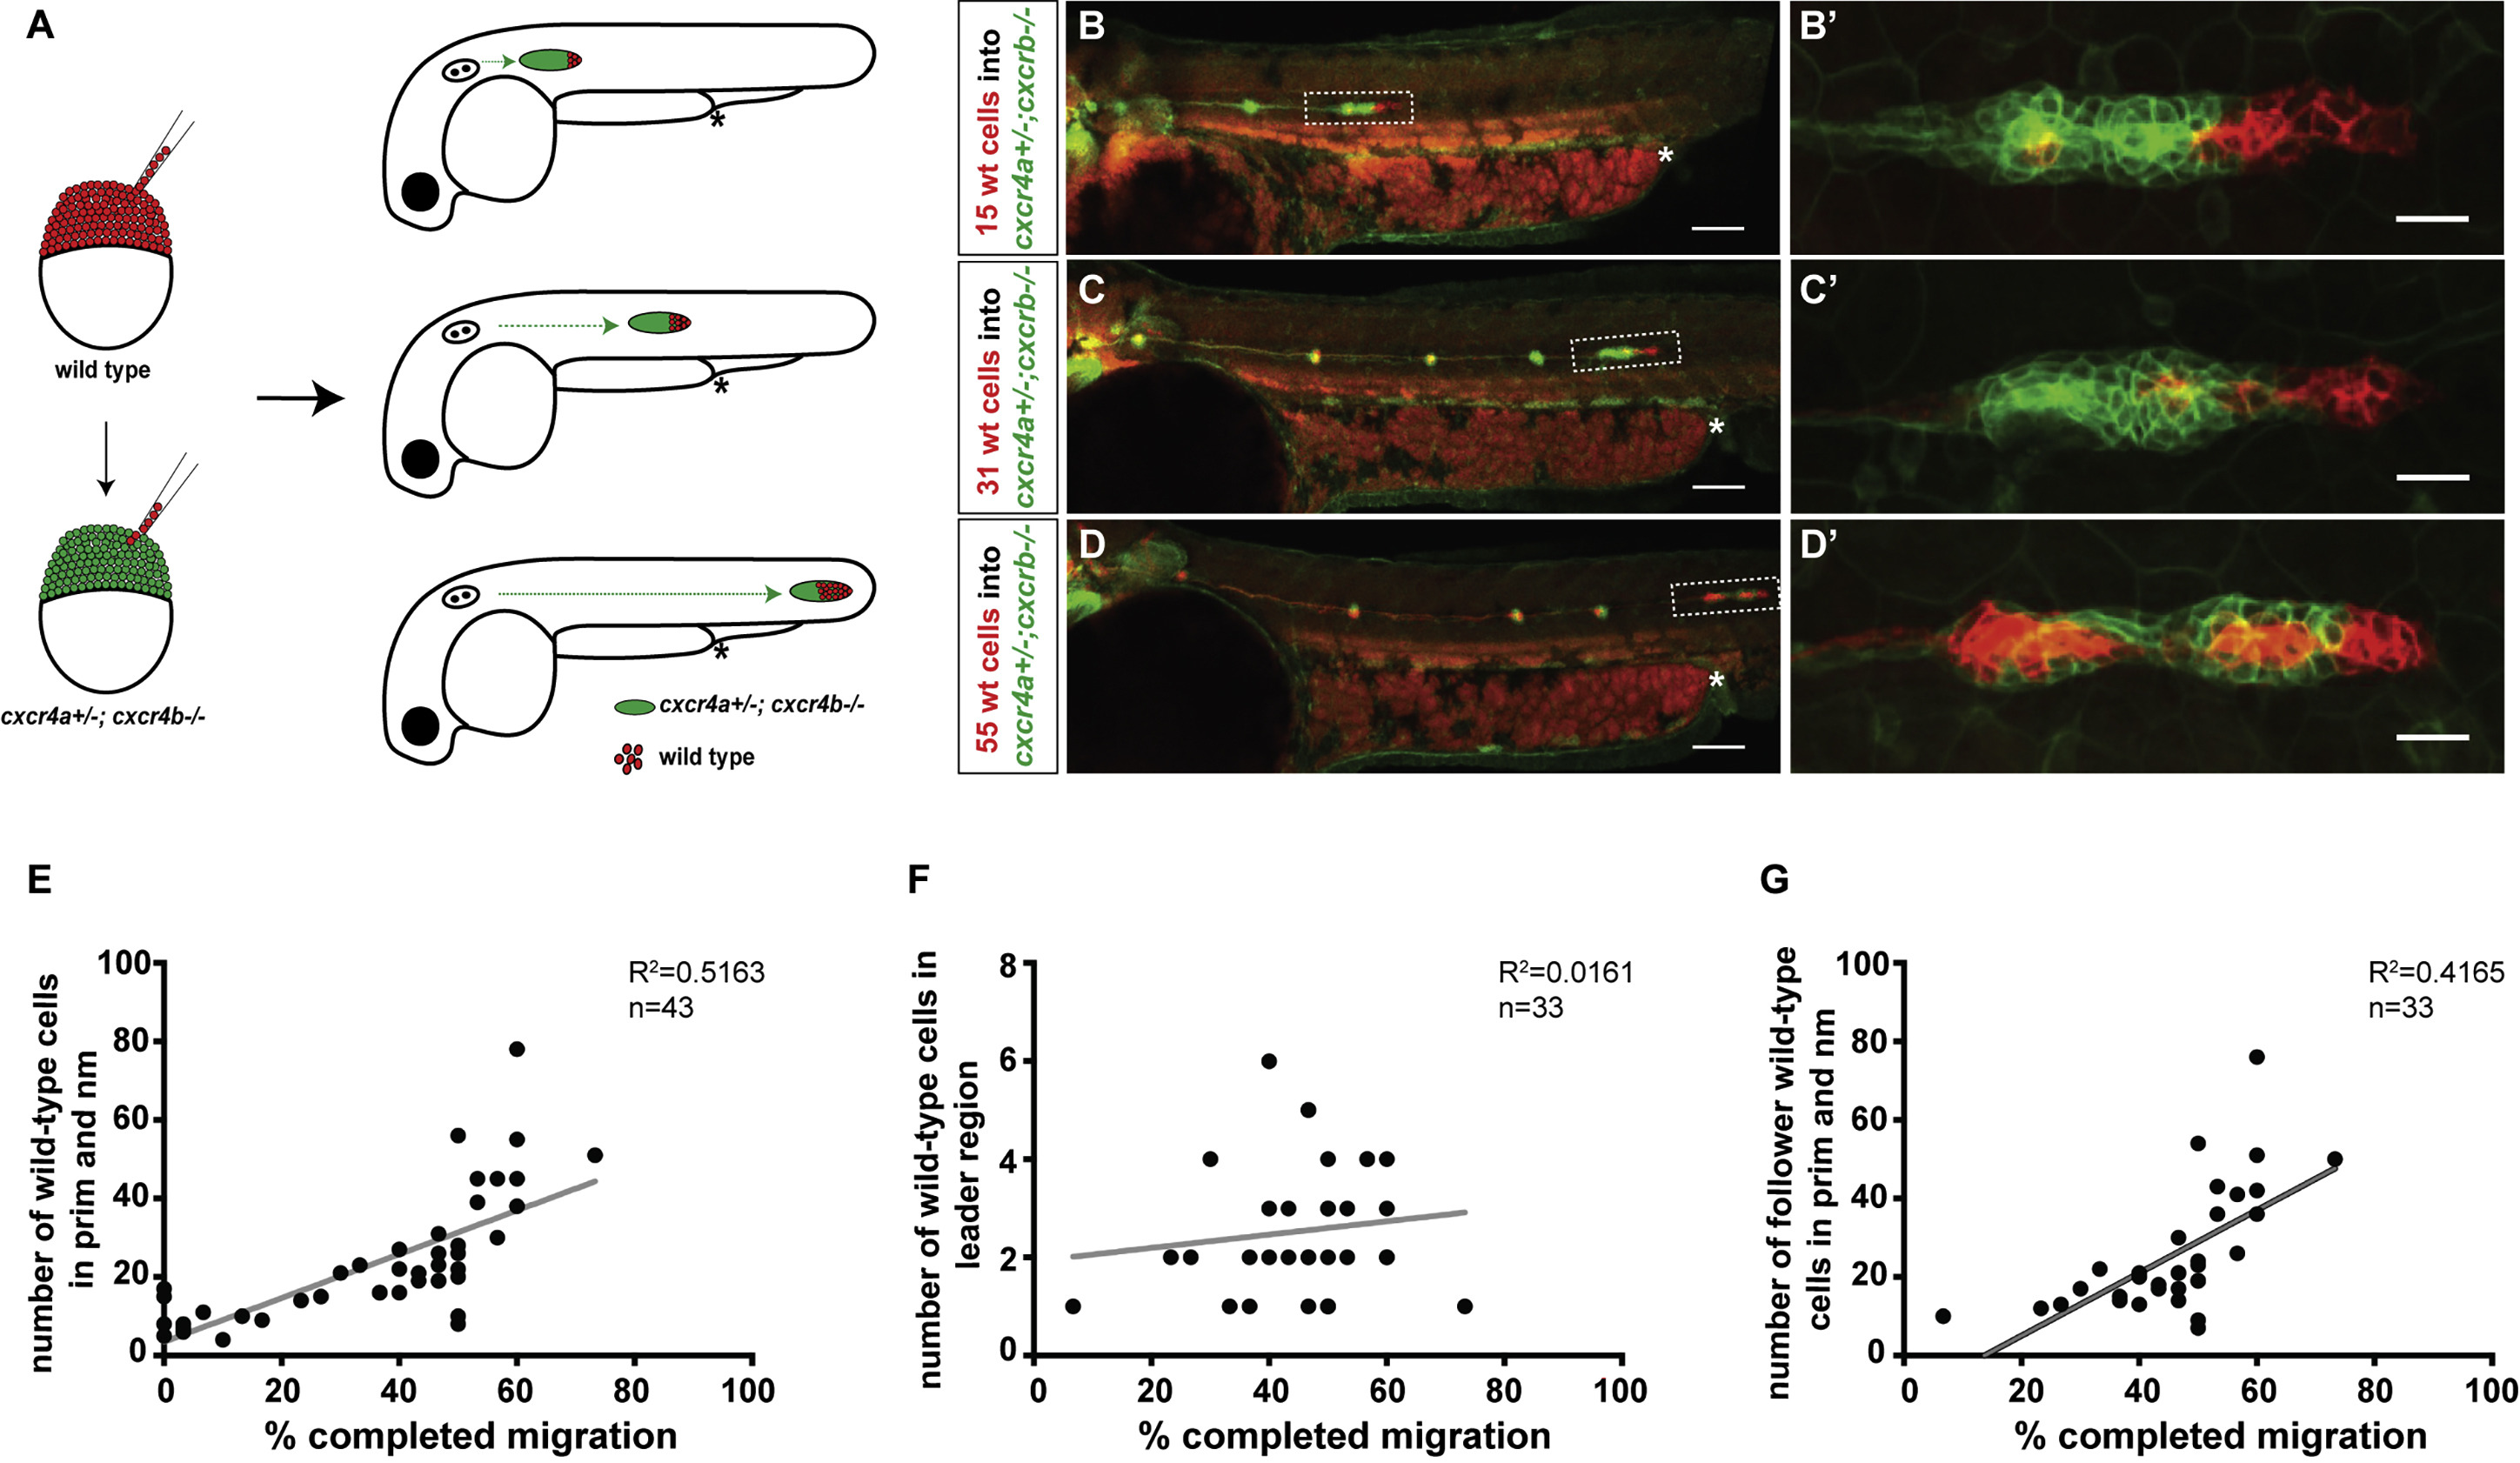
Cxcr4-Deficient Primordia Migrate Farther with Increasing Number of Wild-Type Cells
(A) Experimental design and predictions for migratory behavior of cxcr4-deficient primordia with increasing number of wild-type cells.
(B–D) Sum projections of 48 hpf embryos with chimeric primordia. Wild-type donor-derived cells in primordia are labeled in red with prim:lyn2mCherry and cxcr4a+/−; cxcr4b−/− host-derived cells are labeled in green with cldnB:lyn2GFP (B–D), and magnifications of chimeric primordia are outlined with rectangles in (B–D) (B’–D’). Chimeric primordia migrate further as the number of wild-type donor cells increases in the cxcr4a+/−; cxcr4b−/− primordia. The chimeric primordia are outlined with dashed rectangles, and asterisks mark the end of the yolk extension in (B–D). Scale bars in (B–D) and (B’–D’) represent 100 μm and 20 μm, respectively.
(E) Graph of the migration distance of cxcr4-deficient primordia versus the total number of wild-type cells in the chimeric primordia (total number of wild-type cells includes neuromast [nm] cells and primordium [prim] cells).
(F) Graph of wild-type cell number in the leader cell region (first 15 microns of the front of the primordium as defined in [31]) versus migration distance of cxcr4-deficient chimeric primordia.
(G) Graph of the number of wild-type cells in the follower cell region (past 15 microns from the front of the primordium as defined in [31]) versus migration distance of cxcr4-deficient chimeric primordia.
See also Figure S2 and Methods S2. n indicates the number of chimeric primordia in (E–G).