
|
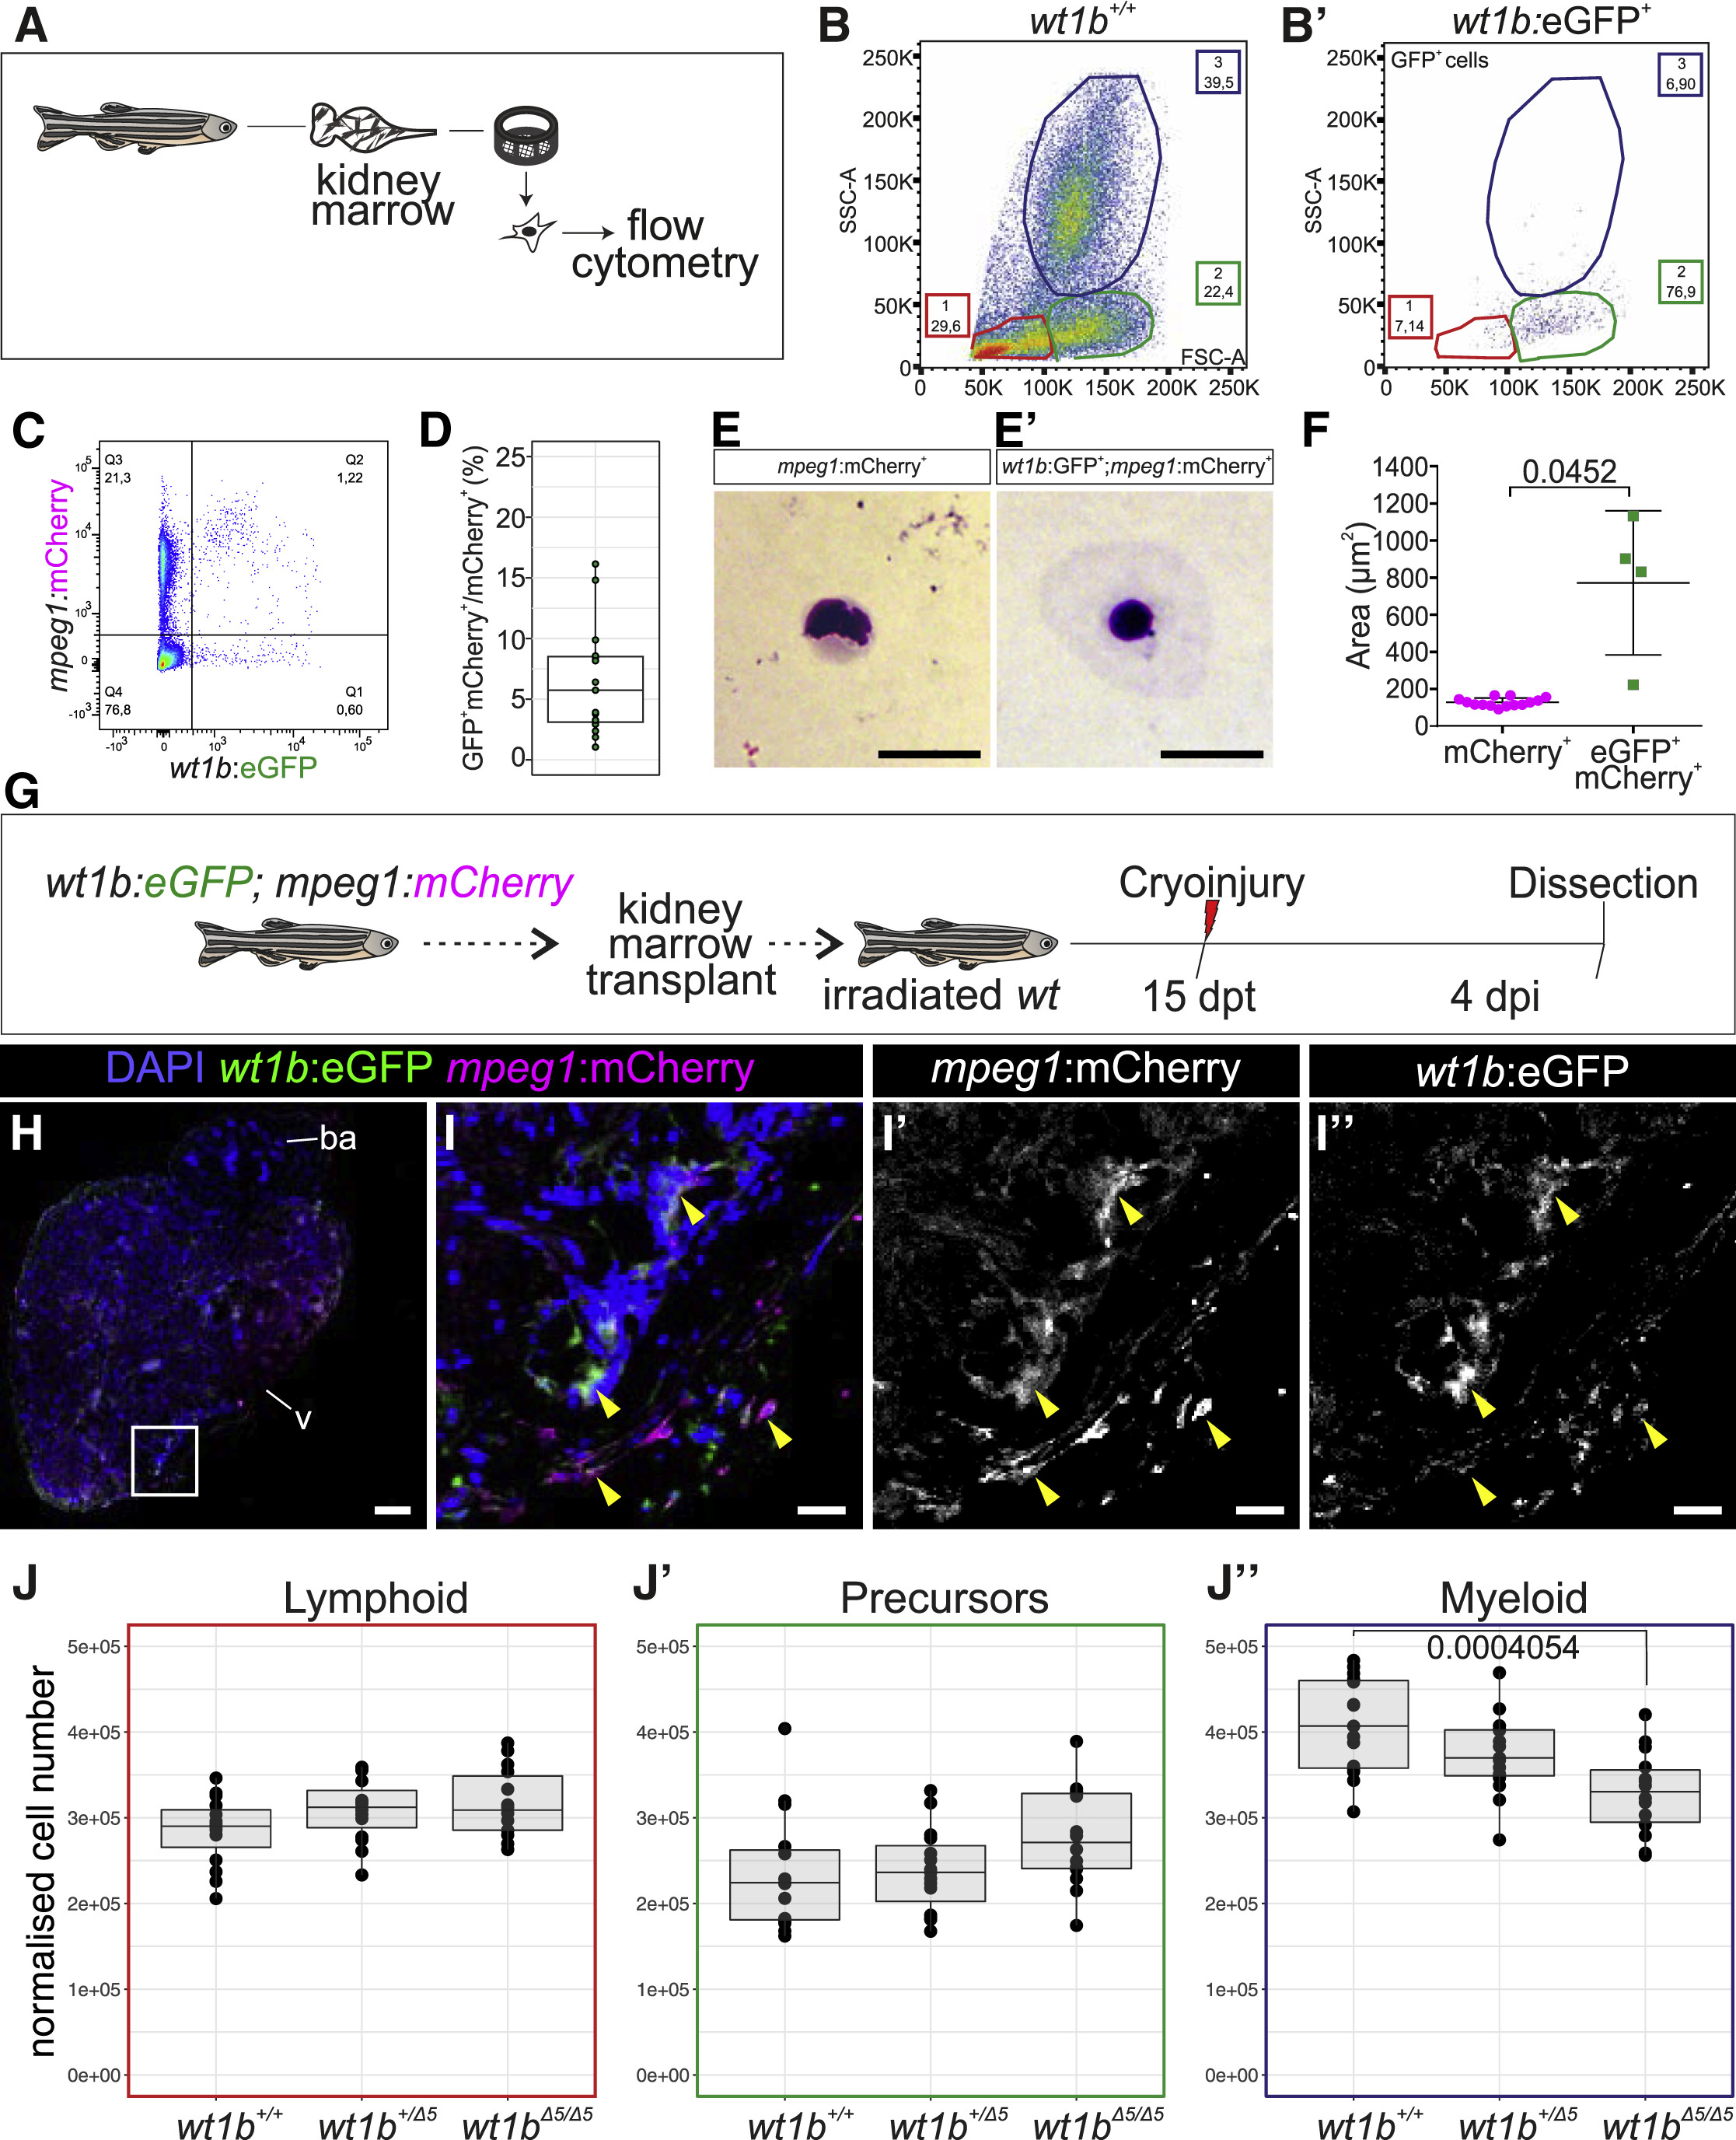
Fig. 4
wt1b:eGFP+ Cells Are Present in the Hematopoietic Niche and Can Contribute to Cardiac Macrophages in the Regenerating Heart
(A) Whole kidney marrow (WKM) cells from different transgenic or mutant lines were isolated and analyzed by flow cytometry.
(B and B’) Forward scatter (FSC-A) versus side scatter (SSC-A) plot of WKM cells. (B) WKM cells of wild-type adult zebrafish gating into 3 distinct populations (gate 1, lymphocytes; gate 2, progenitors; gate 3, myeloid cells). Shown is the percentage of each population normalized to all single alive cells. Erythrocytes were removed from the FACS plot to facilitate data visualization (representative plot of 5 replicates, B, and 2 replicates, B’). (B’) eGFP+ cells from the Tg(wt1b:eGFP) WKM are enriched in gate 2.
(C) Example plot of FACS purified cells from Tg(wt1b:eGFP;mpeg1:mCherry) WKM (representative plot of total n = 15 from 3 experimental replicates).
(D) Quantification of the percentage of eGFP+;mCherry+/mCherry+WKM cells. Means ± SDs are shown. The points are values from individual animals (n = 15 from 3 experimental replicates)
(E and E’) May-Grünwald Giemsa histological staining of mCherry+and eGFP+;mCherry+ WKM cells. A representative example from a total of 245 mCherry+ and 16 eGFP+;mCherry+ cells (2 independent experiments) is shown.
(F) Cell size measurements of mCherry+ and eGFP+;mCherry+ cells. Means ± SDs are shown. The statistical analysis was performed with Welch’s t test.
(G) Tg(wt1b:eGFP;mpeg1:mCherry) WKM cells were transplanted into irradiated wild-type hosts. At 15 days post-transplantation (dpt), the host’s heart was cryoinjured and fixed at 4 days post-injury (dpi).
(H–I’’) IF staining of a heart section from (G).
(I–I’’) are merged and single channels of the magnified view of the boxed area in (H). The yellow arrowheads indicate eGFP+;mCherry+cells. Representative examples from 3 biological replicates from 2 technical replicates are shown.
(J–J’’) Composition of immune cells in the WKM of wt1b+/+, wt1b+/Δ5, and wt1bΔ5/Δ5 lines. Boxplots of normalized cell numbers of cell populations in gates 1 (J, lymphoid), 2 (J’, precursors), or 3 (J’’, myeloid) in wt1b+/+ (n = 15), wt1b+/Δ5 (n = 15), and wt1bΔ5/Δ5 (n = 14) WKM are shown. Data from 3 experimental replicates. Normalized cell numbers relate to cell numbers per 106 events of living single cells. Myeloid cell numbers (J’’) are significantly lower in wt1bΔ5/Δ5than in wt1b+/+ by one-way ANOVA, followed by Tukey’s post hoc test.
Scale bars, 20 μm (E, E’, and H) and 100 μm (I–I’’).