
Image
|
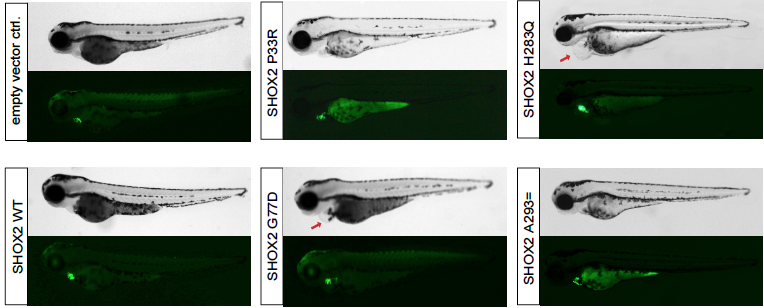
Figure Caption
Fig. S2
Fluorescence imaging of cardiac-specific overexpression of SHOX2 mutants in zebrafish. Bright field (upper image) and corresponding fluorescence imaging (lower image) of cardiac-specific overexpression of SHOX2 mutants compared to SHOX2 WT (wildtype) and empty vector control show pericardial edema (red arrow) for p.G77D and p.H283Q but not for p.P33R and p.A293= 72hpf.
Acknowledgments
This image is the copyrighted work of the attributed author or publisher, and
ZFIN has permission only to display this image to its users.
Additional permissions should be obtained from the applicable author or publisher of the image.
Full text @ Front Genet