
|
Fig. 5
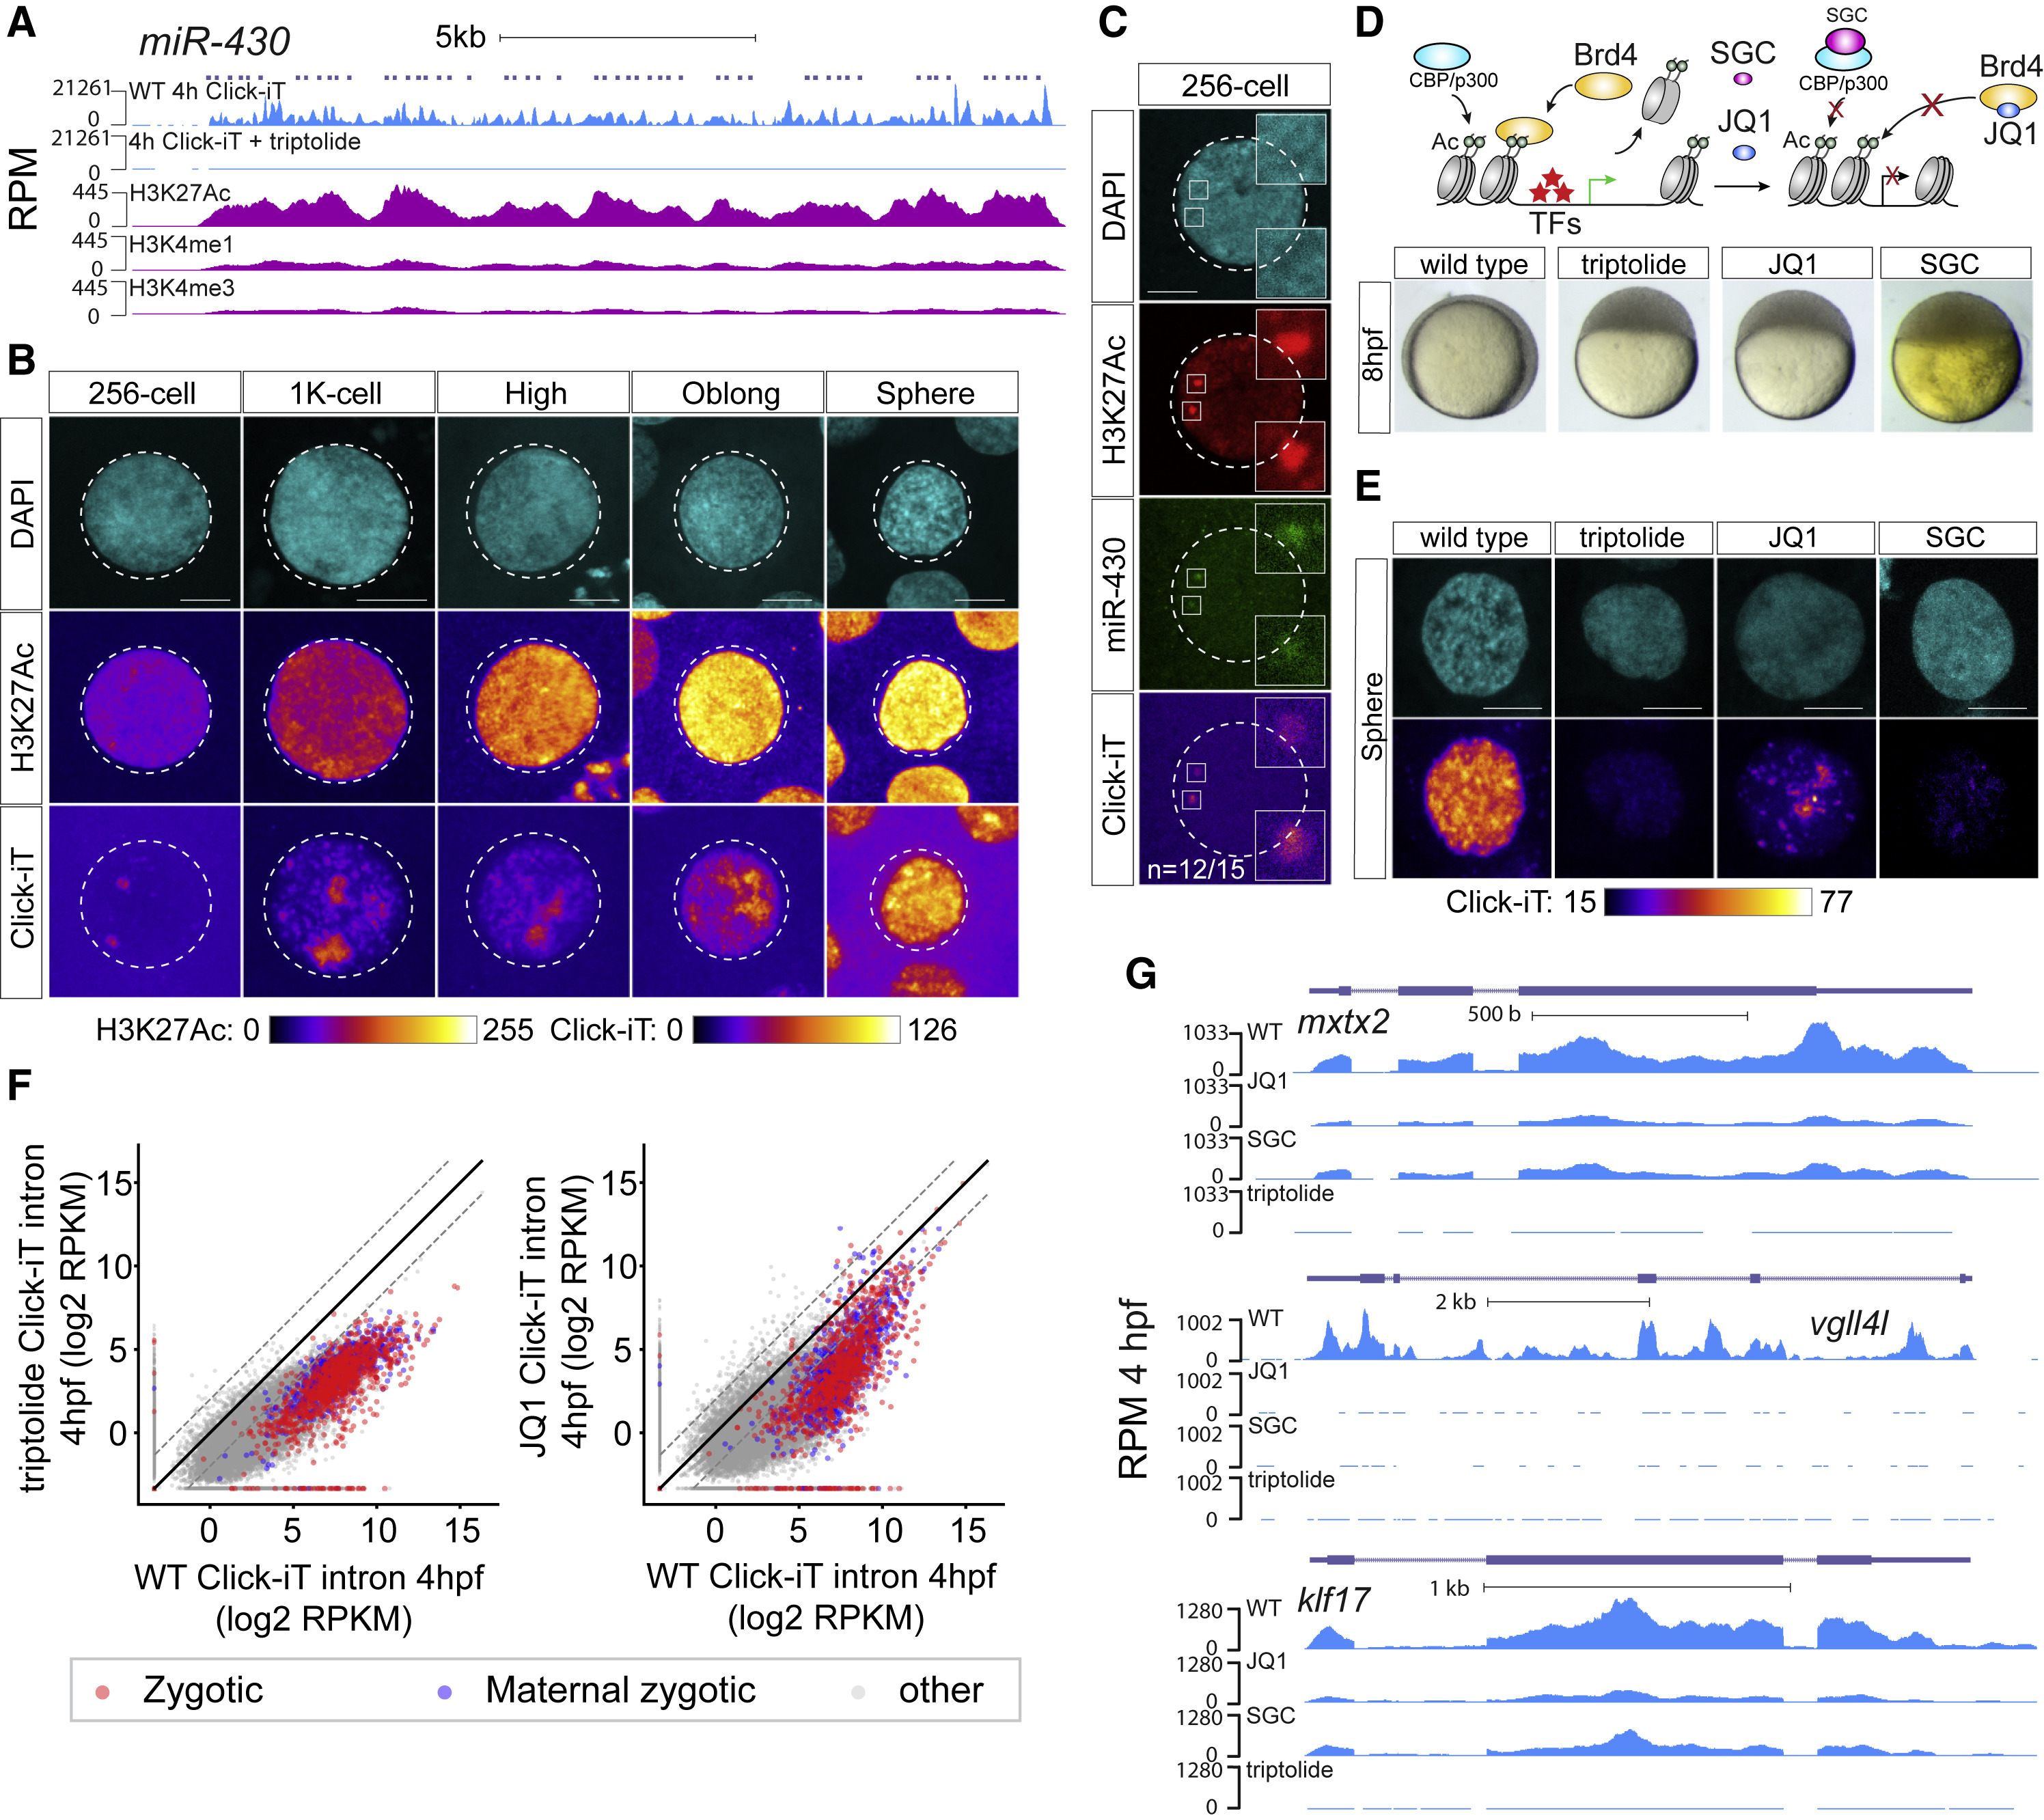
H3K27Ac Correlates with Transcriptional Activation during ZGA
(A) Genome tracks representing normalized Click-iT-seq signal and histone mark level at the miR-430 locus. ChIP-seq data (Bogdanovic et al., 2012). RPM for Click-iT-seq/ChIP-seq (STAR Methods).
(B) Time-resolved single-nucleus confocal imaging analysis of H3K27Ac from 256-cell to sphere stage reveals a positive correlation with the level of Click-iT signal. Both H3K27Ac and Click-iT signal intensity are presented in a heatmap color scale. Scale bar represents 5 μm.
(C) Single-plane confocal image labeled for DAPI, H3K27Ac, dCas9-miR-430, and Click-iT. Note the colocalization of H3K27Ac with Click-iT-labeled transcription activity at the miR-430 locus (n = the fraction of analyzed nuclei that shows the same colocalization of H3K27Ac with Click-iT-labeled transcription at the miR-430 locus as the representative nucleus, >3 independent embryos are imaged). Scale bar represents 5 μm.
(D) Schematic illustrating the selective pharmacologic inhibition of the activity of the BET bromodomain proteins (BRD2-4) and CBP/P300 by JQ1 and SGC, respectively (top). Embryos treated with JQ1 and SGC both arrest before gastrulation similar to those treated with triptolide, consistent with a loss of zygotic transcription (bottom) (Ac, H3K27 acetylation; TFs, transcription factors).
(E) Click-iT imaging analysis in wild-type (WT), triptolide, JQ1, and SGC-treated embryos reveals a significant reduction in transcription by the treatment of JQ1 and SGC. Click-iT signal intensity is presented in a heatmap color scale. Scale bar represents 5 μm.
(F) Biplot comparing intron expression levels of genes measured by Click-iT-seq in triptolide- (left) and JQ1-treated (right) embryos with WT embryos at 4 hpf. Dashed lines represent 4-fold change.
(G) Genome tracks representing normalized Click-iT-seq signal measured at 4 hpf in WT, triptolide, JQ1, and SGC-treated embryos for examples of zygotic genes. RPM (STAR Methods).
Reprinted from Developmental Cell, 49, Chan, S.H., Tang, Y., Miao, L., Darwich-Codore, H., Vejnar, C.E., Beaudoin, J.D., Musaev, D., Fernandez, J.P., Benitez, M.D.J., Bazzini, A.A., Moreno-Mateos, M.A., Giraldez, A.J., Brd4 and P300 Confer Transcriptional Competency during Zygotic Genome Activation, 867-881.e8, Copyright (2019) with permission from Elsevier. Full text @ Dev. Cell