
Image
|
Figure Caption
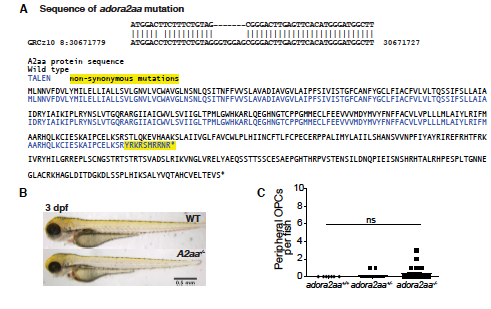
Fig. S5
Characterization of adora2aa mutant larvae. (A) DNA sequence (top) and predicted protein sequence of adora2aact845 compared to WT. (B) Brightfield images of 3 dpf WT and adora2aa-/- larvae. (C) Mean ± SEM of peripheral OPCs per larvae for adora2aa+/- and adora2aa-/- larvae at 3 dpf. p=0.24, n = 20 (adora2aa+/-), n = 26 (adora2aa-/-). Scale bar, 0.5 mm.
Acknowledgments
This image is the copyrighted work of the attributed author or publisher, and
ZFIN has permission only to display this image to its users.
Additional permissions should be obtained from the applicable author or publisher of the image.
Full text @ Cell Rep.