
|
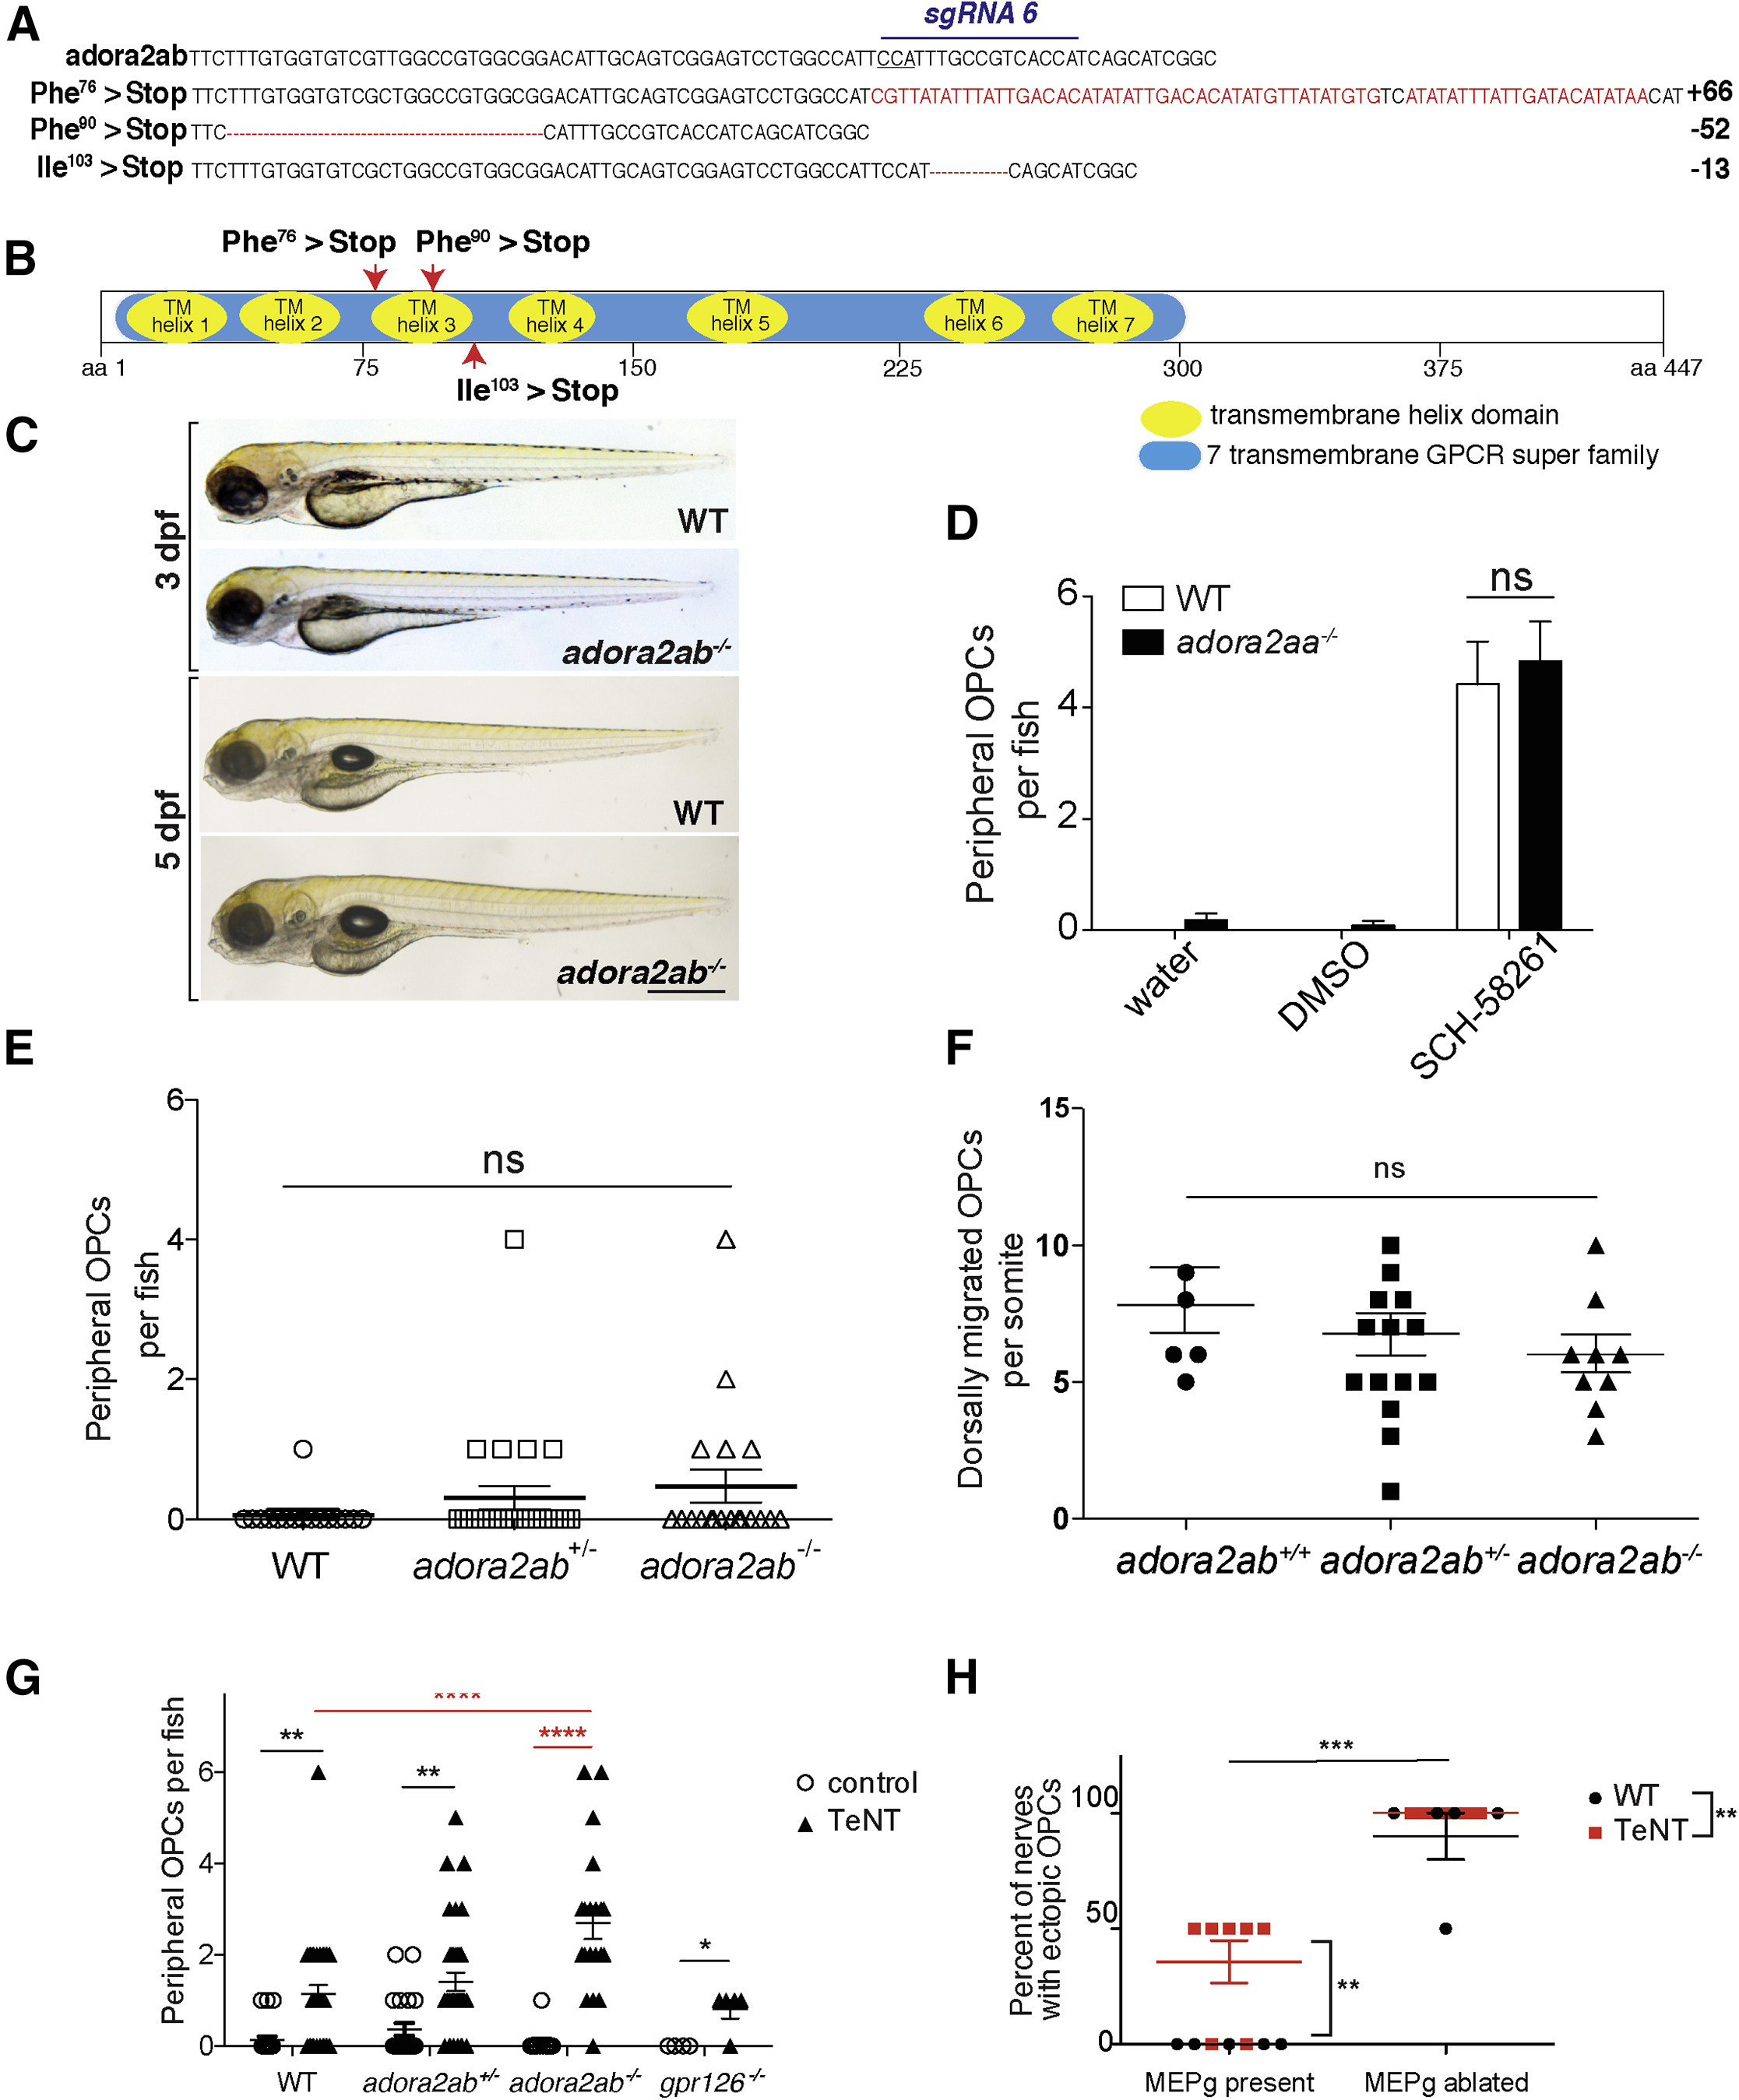
Fig. 4
A2ab ARs Influence OPC Migration at the MEP TZ
(A) adora2ab WT and germline CRISPR mutant DNA sequences. sgRNA target and PAM site (underlined) are shown on WT sequence. Red letters or dashes indicate insertions or deletions.
(B) Diagram of A2ab protein with locations of early stops caused by adora2abuva6, adora2abuva7, and adora2abuva9.
(C) Bright-field images of WT and adora2ab−/− siblings at 3 and 5 dpf.
(D) Mean ± SEM of peripheral OPCs per fish for olig2:dsred;adora2aa−/−and WT larvae treated with water, DMSO, or 10 μM SCH-58261 from 36 hpf to 3 dpf. n = 12 fish; p < 0.0001 for treatment, p = 0.53 for genotype, p = 0.93 for interaction of treatment and genotype.
(E) Mean ± SEM of peripheral OPCs per fish for olig2:dsred;adora2ab−/−, adora2ab+/−, and WT larvae. p = 0.32; n = 19 adora2ab−/−, n = 26 adora2ab+/−, and n = 16 WT.
(F) Mean ± SEM of dorsally migrated OPCs per somite at 72 hpf. p = 0.43; n = 6 WT, n = 16 adora2ab+/−, n = 9 adora2ab−/−.
(G) Mean ± SEM of peripheral OPCs per fish for olig2:dsred;adora2ab−/−, gpr126−/−, and WT larvae injected with injection buffer (control) or TeNT mRNA. ∗∗p = 0.0088 (WT versus WT + TeNT), ∗∗p = 0.0053 (adora2ab+/− versus adora2ab+/− + TeNT), and ∗∗∗∗p < 0.0001 (adora2ab−/−versus adora2ab−/− + TeNT); p = 0.99 (WT + TeNT versus gpr126−/− + TeNT) and (WT + TeNT versus adora2ab−/− + TeNT). n = 22 WT, n = 22 adora2ab+/−, n = 13 adora2ab−/−, n = 36 WT + TeNT, n = 32 adora2ab+/− + TeNT, n = 20 adora2ab−/− + TeNT, n = 4 gpr126+/+, and n = 5 gpr126−/− + TeNT. Red asterisks highlight significant comparisons relevant for the experiment.
(H) Mean ± SEM of the percentage of nerves with peripheral OPC bodies and/or processes at 3 dpf following TeNT mRNA injections and/or MEP glial ablation. For each WT or TeNT-injected larva, two nerves were analyzed with MEP glia ablated, and two nerves were analyzed with MEP glia intact in the same larva. n = 5 larvae (uninjected), n = 7 larvae (TeNT). ∗∗p = 0.004 for TeNT versus WT, p < 0.0001 for MEP glia ablated versus MEP glia present. Scale bar, 0.5 mm.