
|
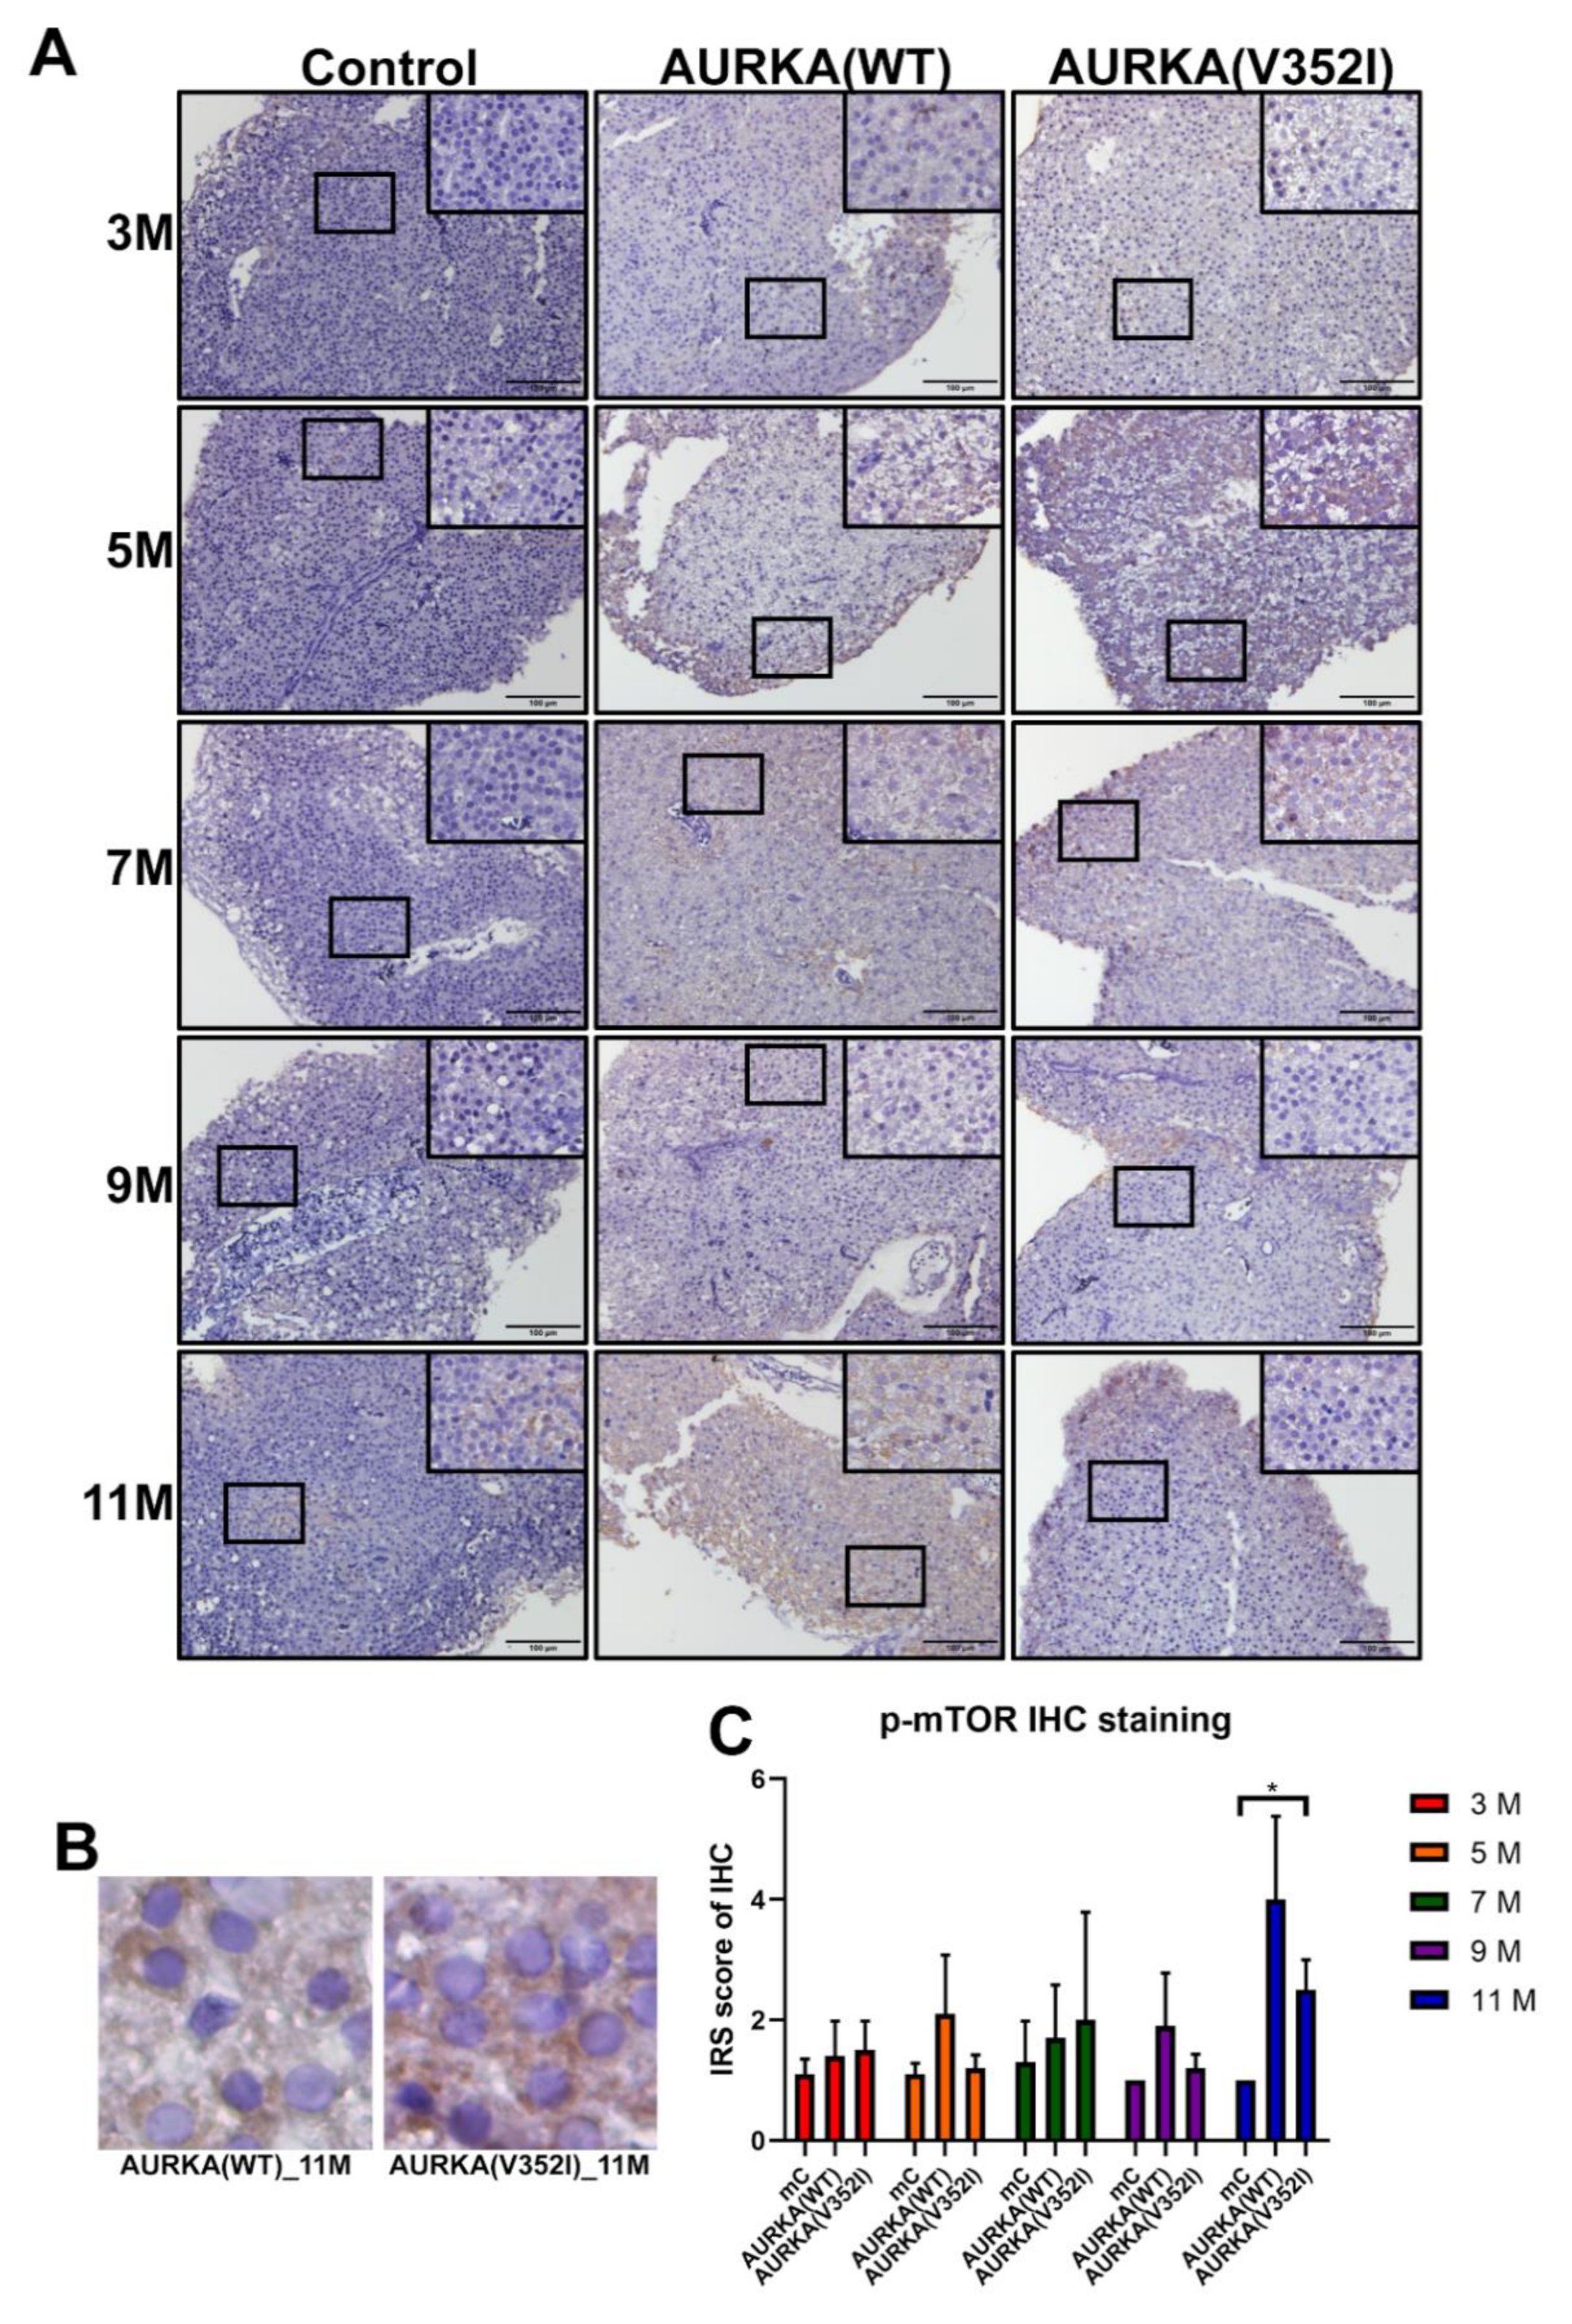
Fig. 11
Immunoreactive score of phospho- mammalian target of the rapamycin (mTOR) (at Ser2448, inactive form) immunostaining for the AKT/mTOR pathway reveals that the expression of mTOR has no significant difference between control and AURKA transgenic fish. (A) Representative images of p-mTOR staining for PTEN in control, AURKA(WT), and AURKA(V352I) at 3, 5, 7, 9, and 11 months; (B) Selected enlarged images show the p-mTOR signals from AURKA(WT)—11 M and AURKA(V352I)—11 M; (C) Statistical analysis of p-mTOR immunostaining IRS score at 3, 5, 7, 9, and 11 months. IRS score of control fish (Tg(fabp10a:EGFP-mCherry) abbreviated as mC, AURKA(WT) and AURKA(V352I) is shown in red (3 M), orange (5 M), green (7 M), purple (9 M), and blue (11 M). Statistical analysis of results was performed using a two-tailed Student’s t-test. The error bar means standard deviation. Asterisks (*) represent the level of significance. * p-value ≤ 0.05.