
Image
|
Figure Caption
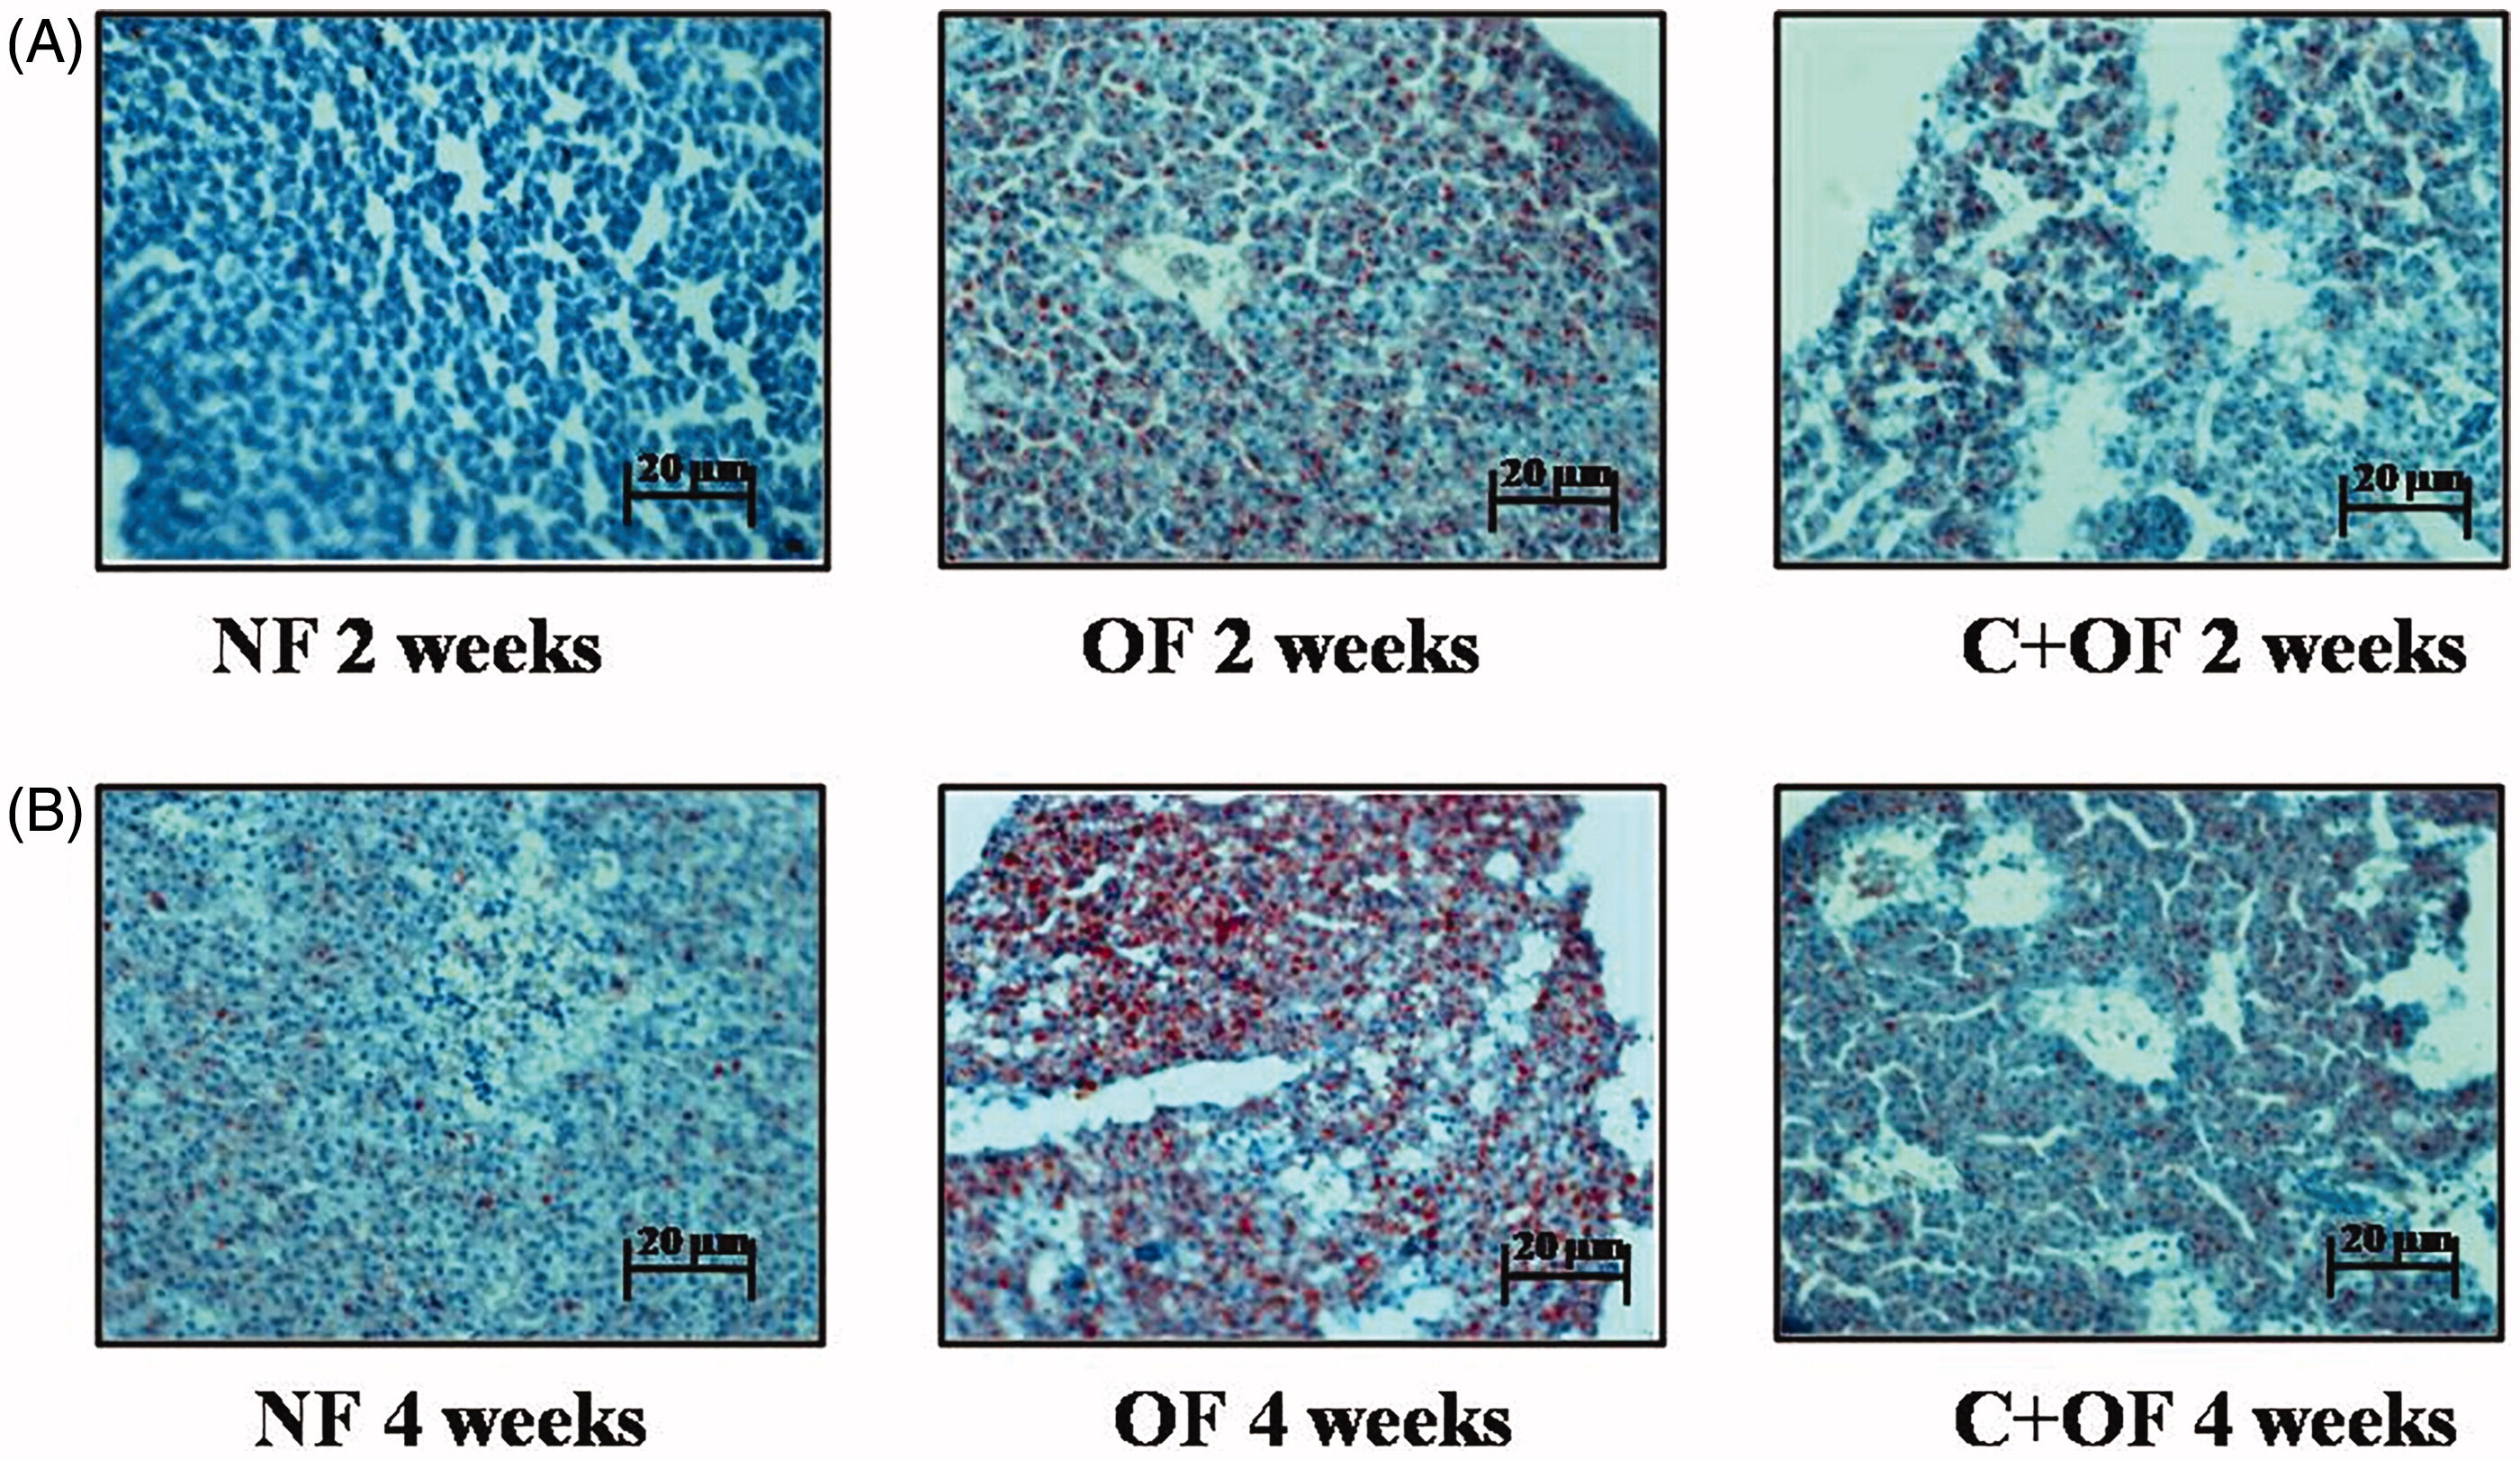
Fig. 6
Histology of liver using Oil Red O staining and haematoxylin staining. (A) Oil Red O staining at 2 weeks endpoint- Significant accumulation of fat was seen in overfeeding group, with reduction in fat accumulation in liver tissues at 4 weeks endpoint. (B) Oil Red O staining at 4 weeks endpoint - At the end of 4 weeks, immense increase in fat accumulation was observed in fishes subjected to overfeeding; however, cinnamon treatment along with overfeeding resulted in reduction of fat storage in liver tissues.
Figure Data
Acknowledgments
This image is the copyrighted work of the attributed author or publisher, and
ZFIN has permission only to display this image to its users.
Additional permissions should be obtained from the applicable author or publisher of the image.
Full text @ Artif Cells Nanomed Biotechnol