
|
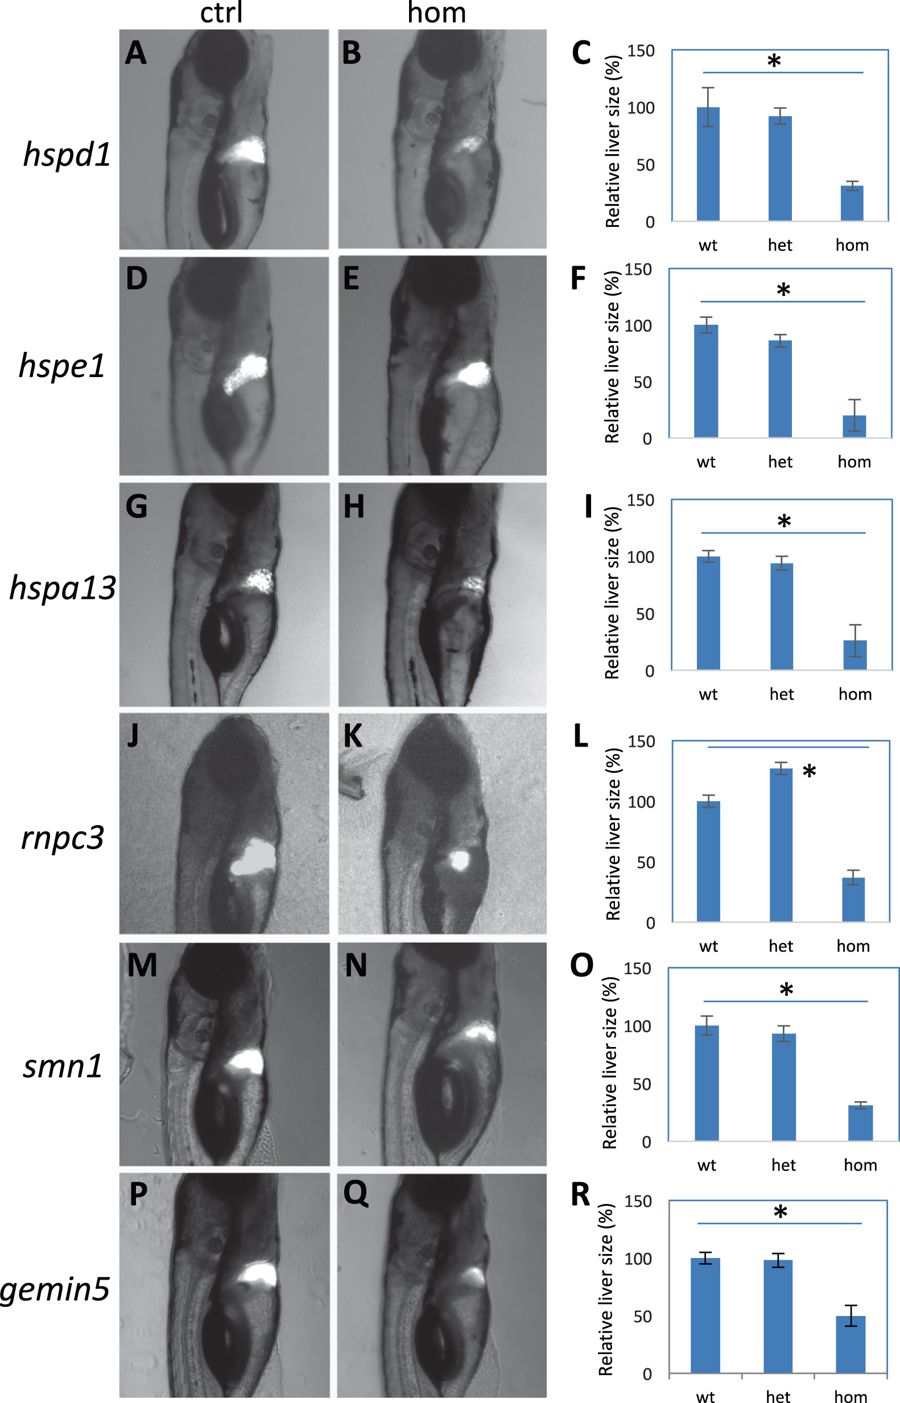
Fig. 5
Liver regeneration in the mutants. a–c Regenerated liver in the control (a) and hspd1la026911 mutant (b), and the quantification of the liver areas (c). d–f Regenerated liver in the control (d) and hspe1hg77 mutant (e), and the quantification of the liver areas (f). g–i Regenerated liver in the control (g) and hspa13hg78 mutant (h), and the quantification of the liver areas (i). j–l Regenerated liver in the control (j) and rnpc3la028632 mutant (k), and the quantification of the liver areas (l). m–o Regenerated liver in the control (m) and smn1fh299 mutant (n), and the quantification of the liver areas (o). p–r Regenerated liver in the control (p) and gemin5hg80 mutant (q), and the quantification of the liver areas (r). Graphs are generated from analysis of approximately 45 CFP-positive embryos obtained by crossing one fish carrying heterozygous gene mutation with the other fish carrying heterozygous mutation and an allele of Tg(fabp10:CFP-NTR). Error bars show the s.e.m. Control (Ctrl) represents both wild-type and heterozygotes, as there was no difference observed between them. A significant difference was observed between the wild-type and the mutant for all the mutations (p < 0.05 for all)