
|
Fig. 2
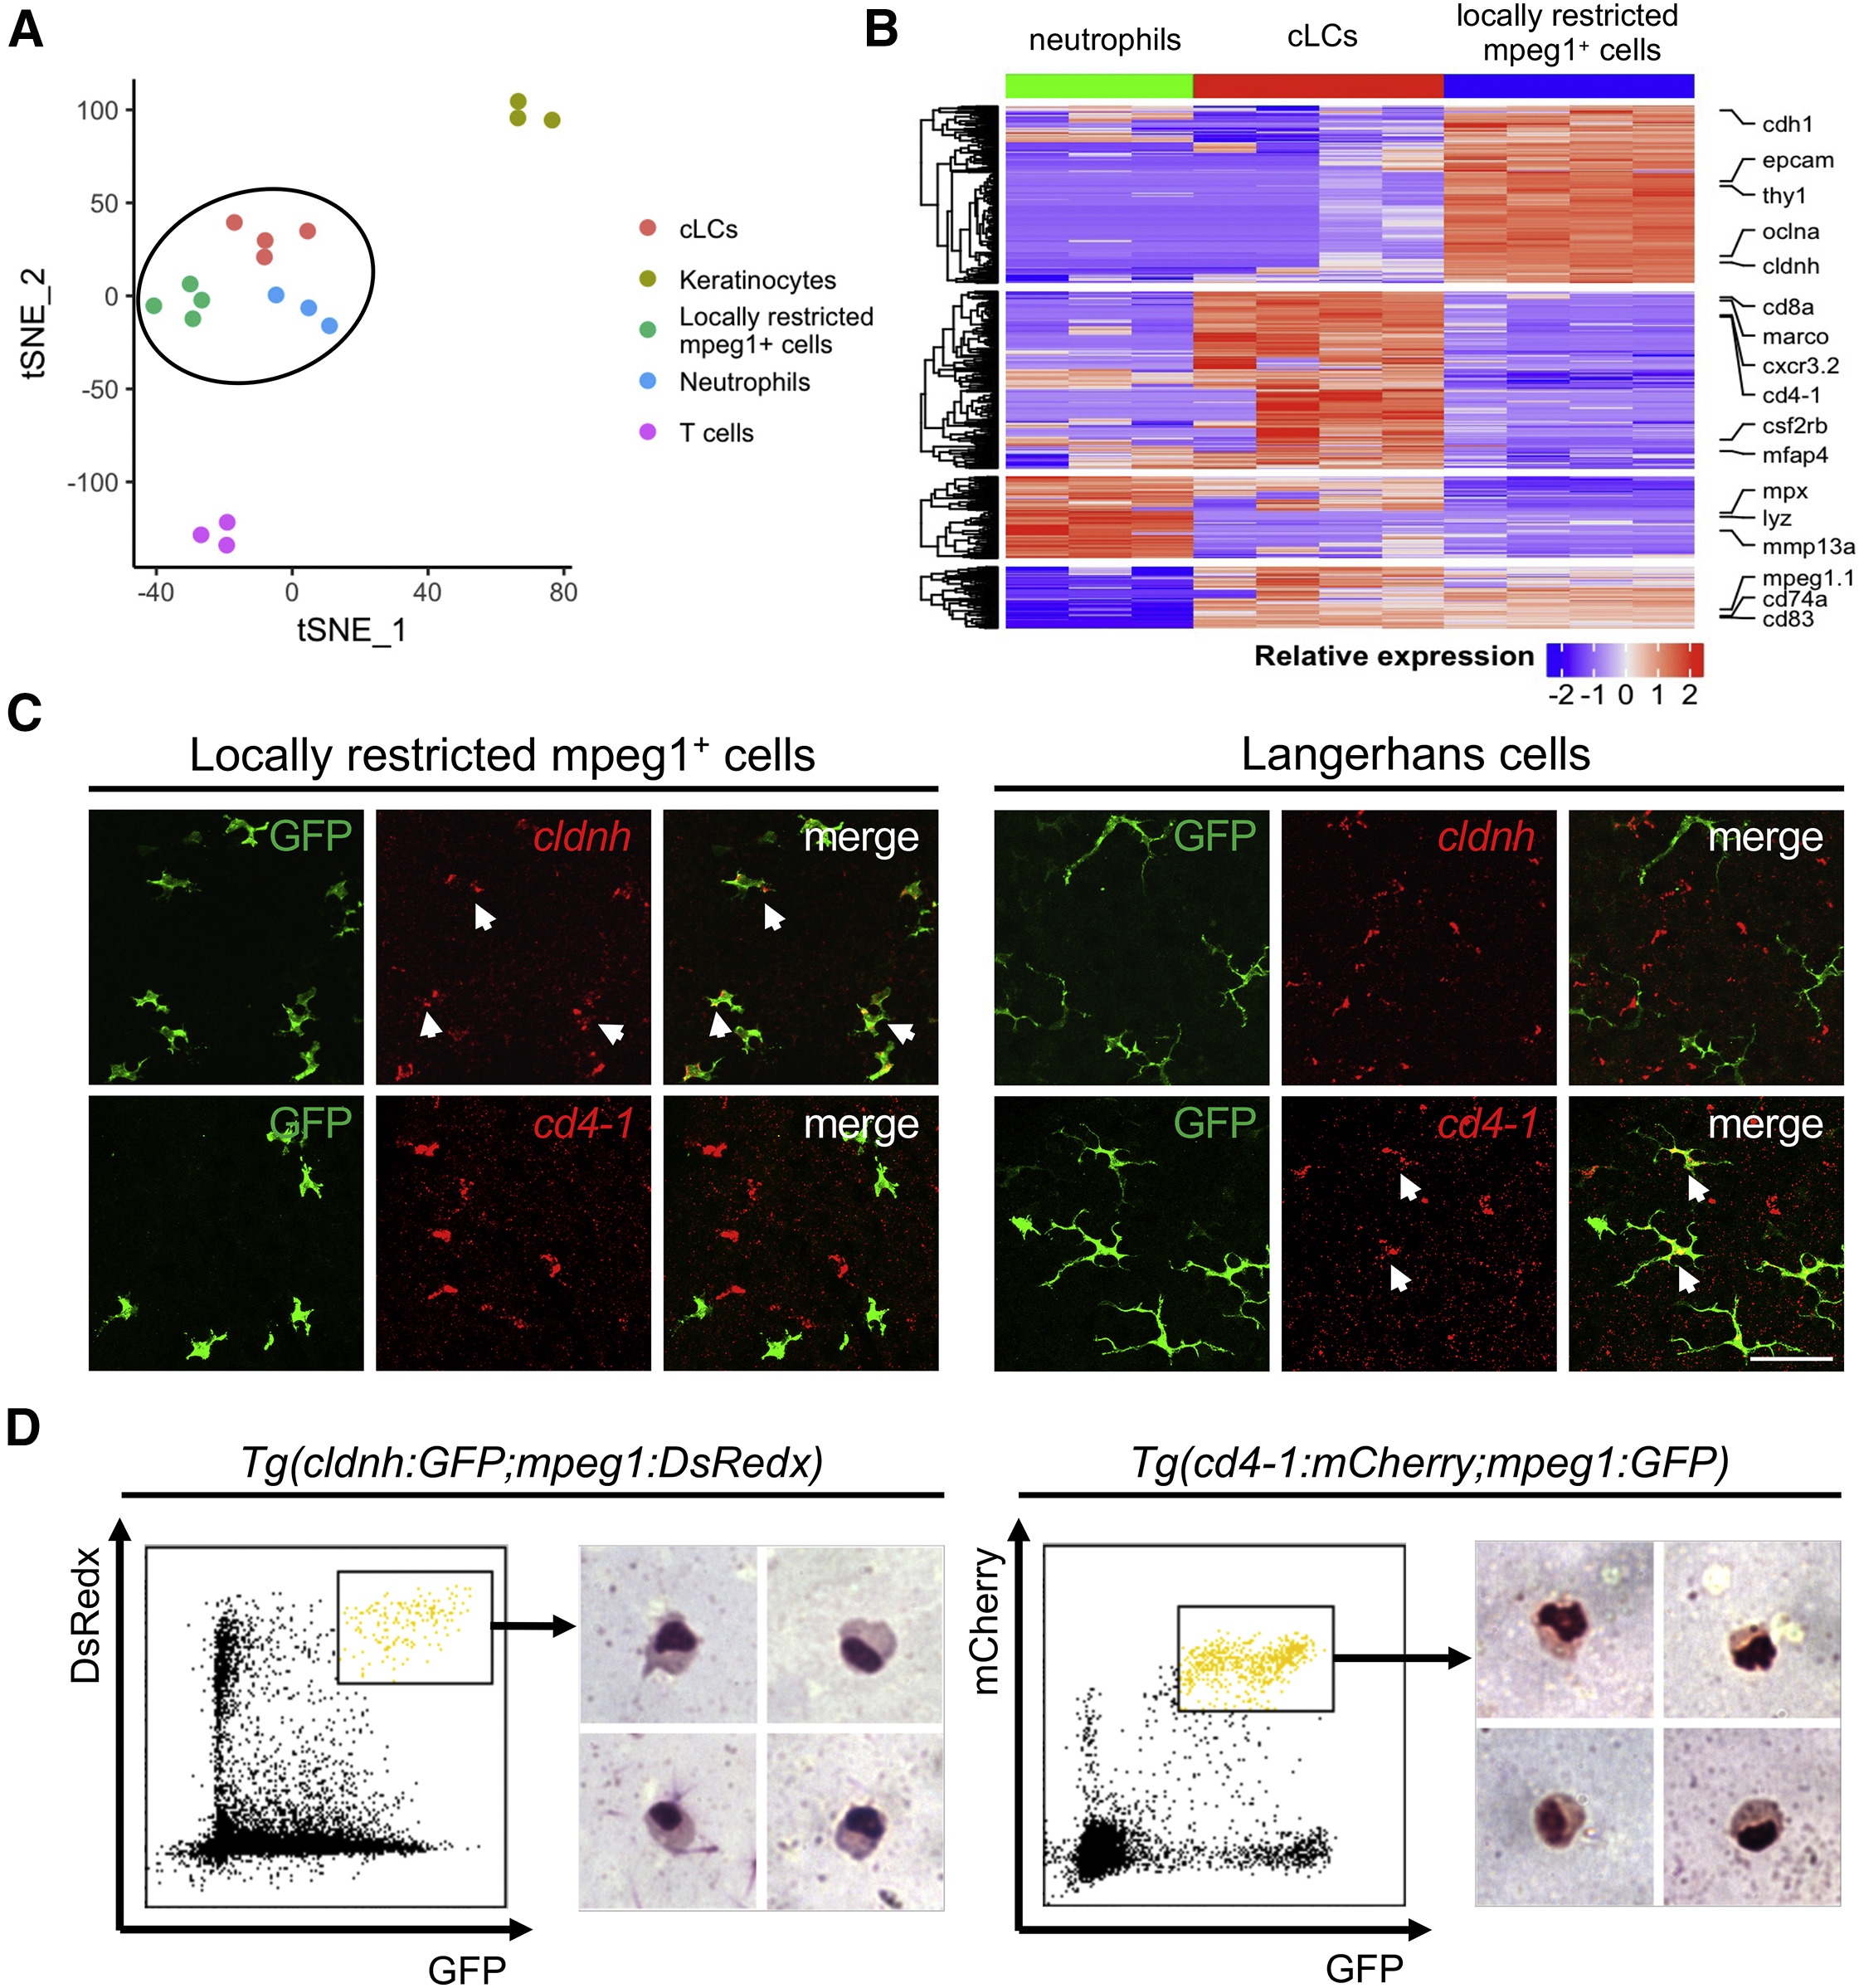
Locally Restricted mpeg1+ Cells Are Highly Similar to cLCs in Transcriptome and Cellular Morphology
(A) t-SNE analysis of five different cell populations isolated from the epidermis of adult fish: locally restricted mpeg1+ cells (n = 4), cLCs (n = 4), neutrophils (n = 3), keratinocytes (n = 3), and T cells (n = 3). Locally restricted mpeg1+ cells cluster together with cLCs and neutrophils.
(B) Heatmap shows relative expression of a total of 613 differentially expressed genes (|log2FC| > 1, FDR < 0.05) among neutrophils, cLCs, and locally restricted mpeg1+ cells. Representative genes are indicated at the right.
(C) In situ hybridization of cldnh (red) and cd4-1 (red) in irradiated scales, followed by anti-GFP staining of locally restricted mpeg1+ cells (green) and cLCs (green). White arrows indicate co-localization of cldnh with locally restricted mpeg1+ cells, and cd4-1 with cLCs. Scale bar, 50 μm.
(D) Geimsa staining of locally restricted mpeg1+ cells and cLCs sorted from the epidermis of adult Tg(cldnh:GFP;mpeg1:DsRedx) fish (n = 3) and Tg(cd4-1:mCherry;mpeg1:GFP) fish (n = 3).
Reprinted from Developmental Cell, 49(4), Lin, X., Zhou, Q., Zhao, C., Lin, G., Xu, J., Wen, Z., An Ectoderm-Derived Myeloid-like Cell Population Functions as Antigen Transporters for Langerhans Cells in Zebrafish Epidermis, 605-617.e5, Copyright (2019) with permission from Elsevier. Full text @ Dev. Cell