
|
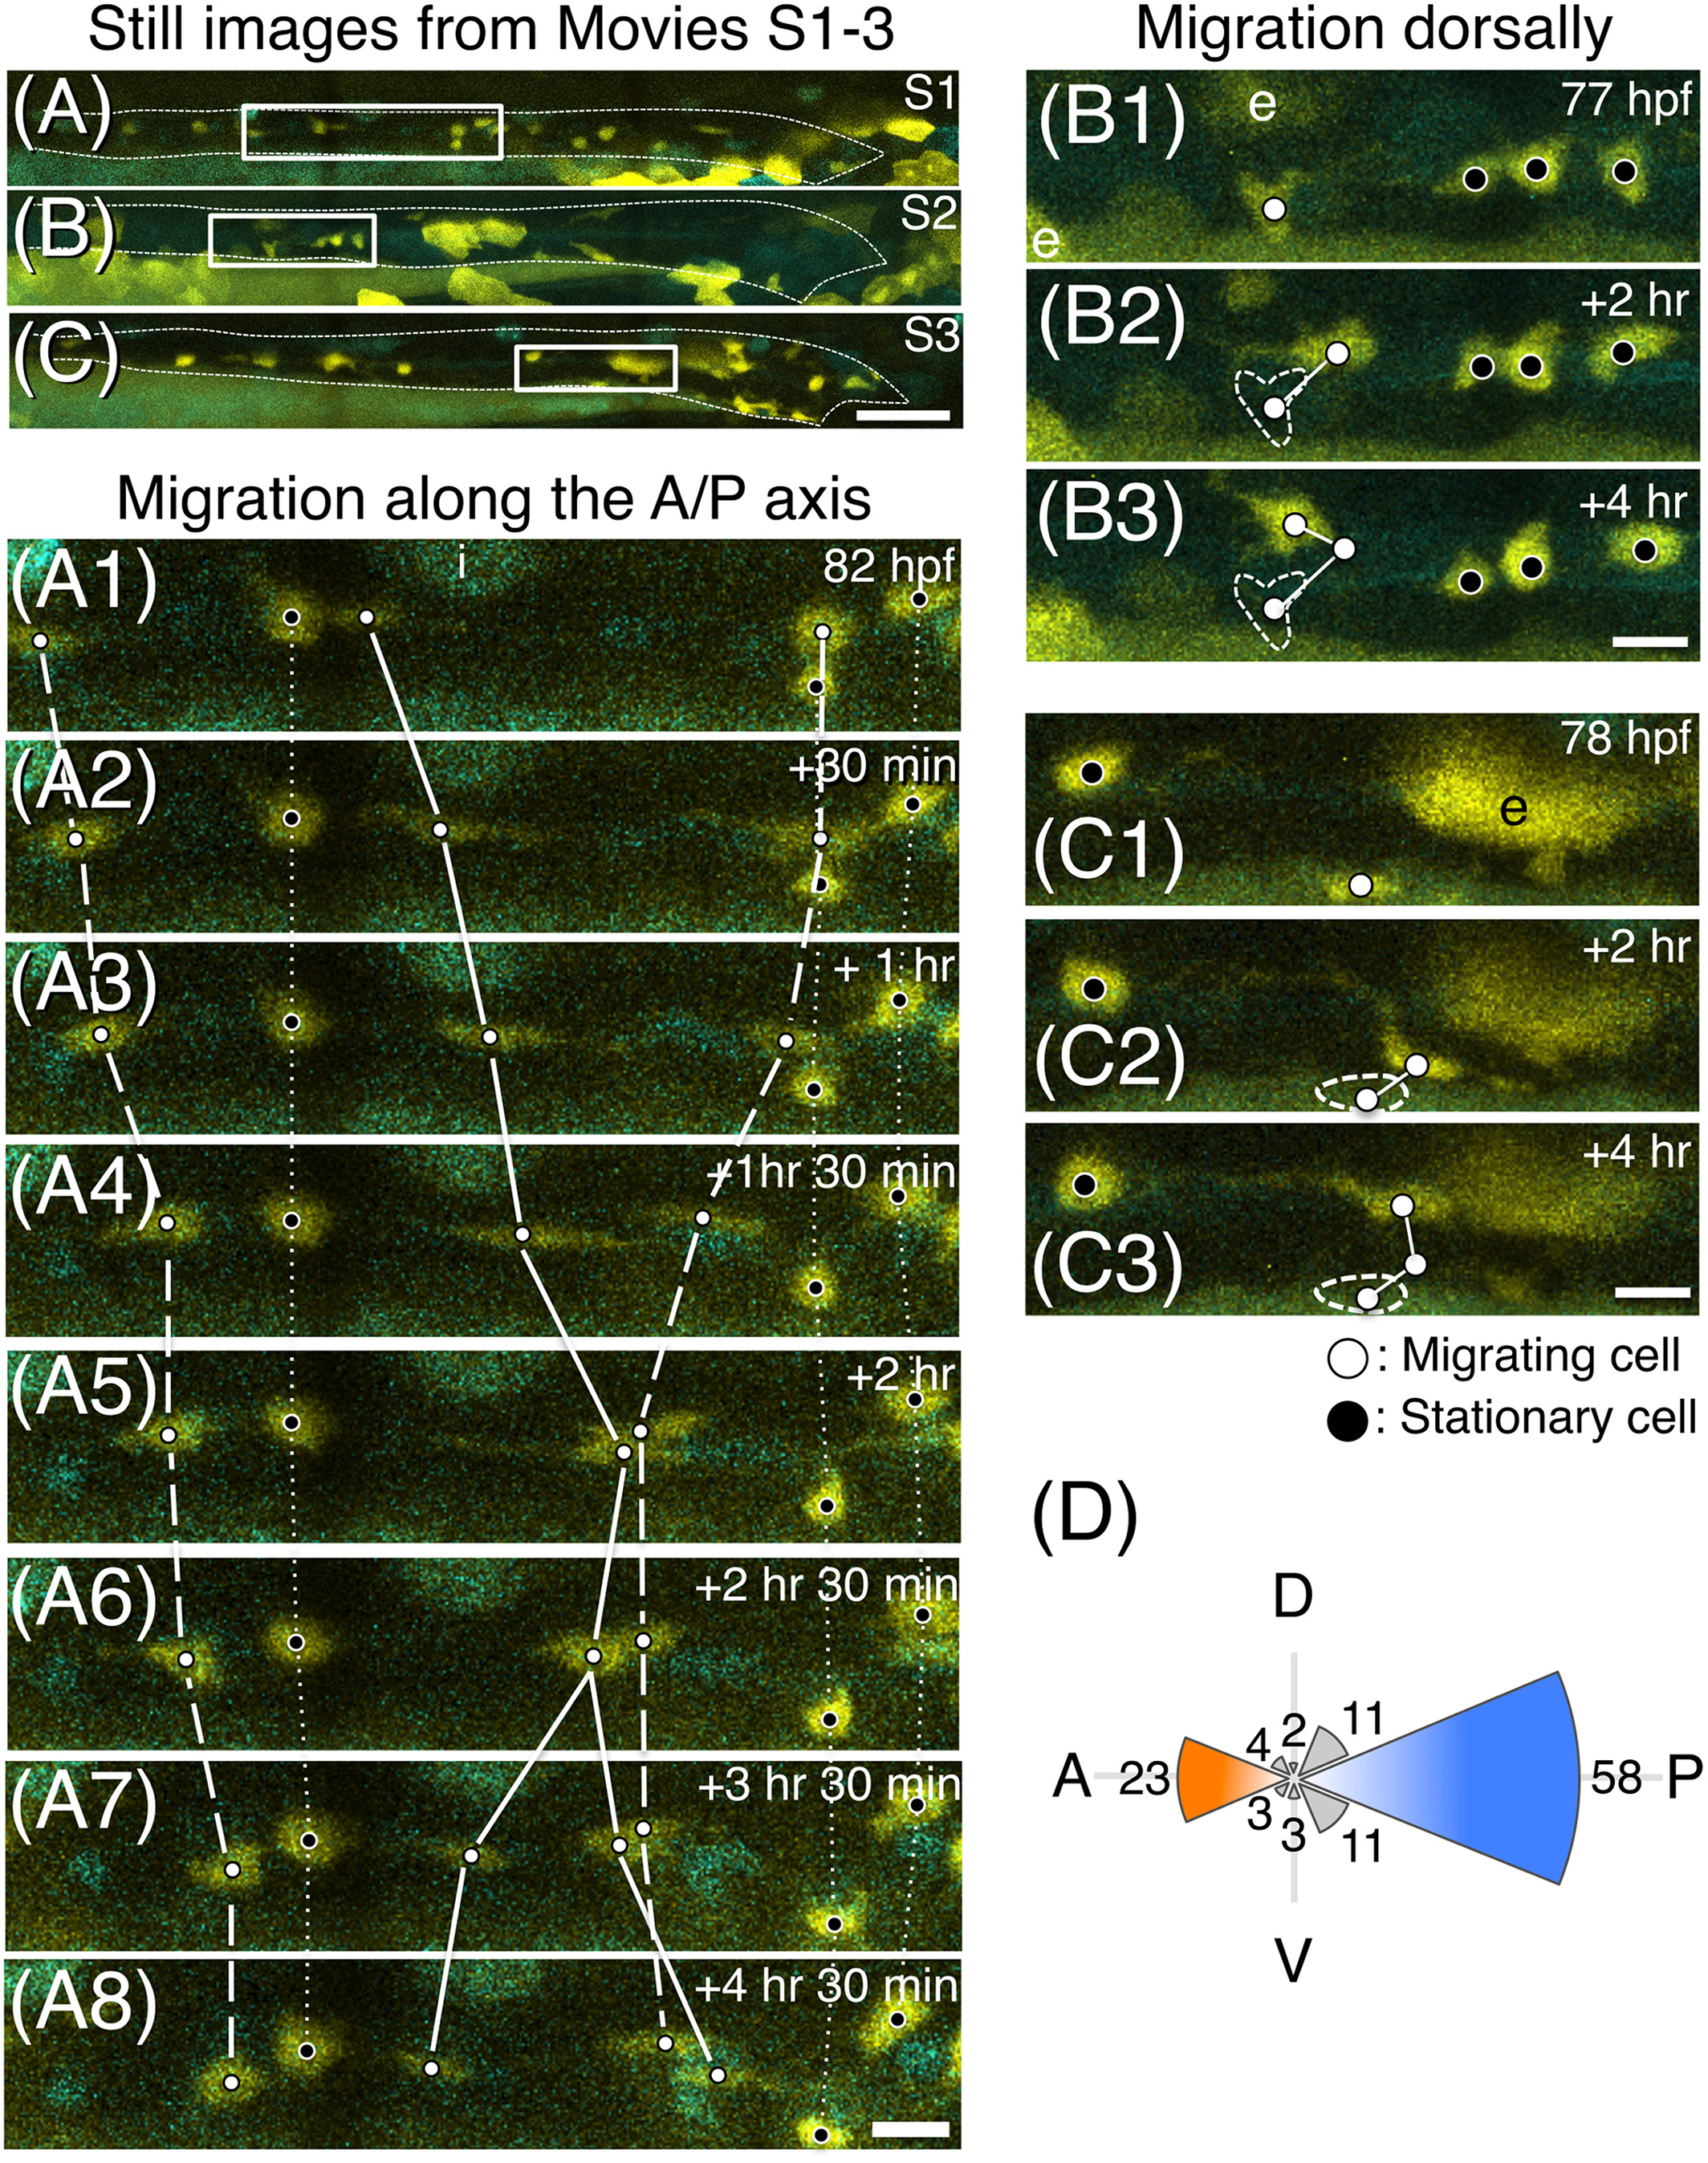
Fig. 3
Multi‐directional migration of ENCCs shown by time‐lapse live imaging. A‐C, Still images from Supplementary Movies S1‐3. Each rectangle indicates the area shown in A1‐8, B1‐3, and C1‐3, respectively. Guts are outlined with white dashed lines. Lateral views of the gut. Anterior, to the left. Scale bar = 50 μm. A1‐8, Still images of a part (images were taken every 30 or 60 min over a period of 4 hr and 30 min starting at 82 hpf) of Supplementary Movie S1. Active migration was observed along the antero‐posterior axis. White dots: migrating cells. Black dots: stationary cells. The same cells in each panel are connected with a solid line (dividing cell), a dashed line (migrating cells), or a dotted line (stationary cells). B1‐3 and C1‐3, Two sets of still images of different embryos showing cells migrating dorsally in a zig‐zag manner (#1 and #2). The trajectory of each cell is shown by white lines, and the original positions of cells seen in (B1, C1) are encircled by white dashed lines in B2, B3 and C2, C3, respectively. Developmental stages are shown in the top right corner in each panel. e: periderm cells. i: iridophore. Scale bars = 10 μm. D, Polar histogram representing the directions of the migration at 1‐hr intervals. The directions were determined by constructing a straight line from a position of cell with its position 1 hr after migration. The number of cells that migrate in each direction represented by an octant during 1‐hr period is proportional to its radius