
|
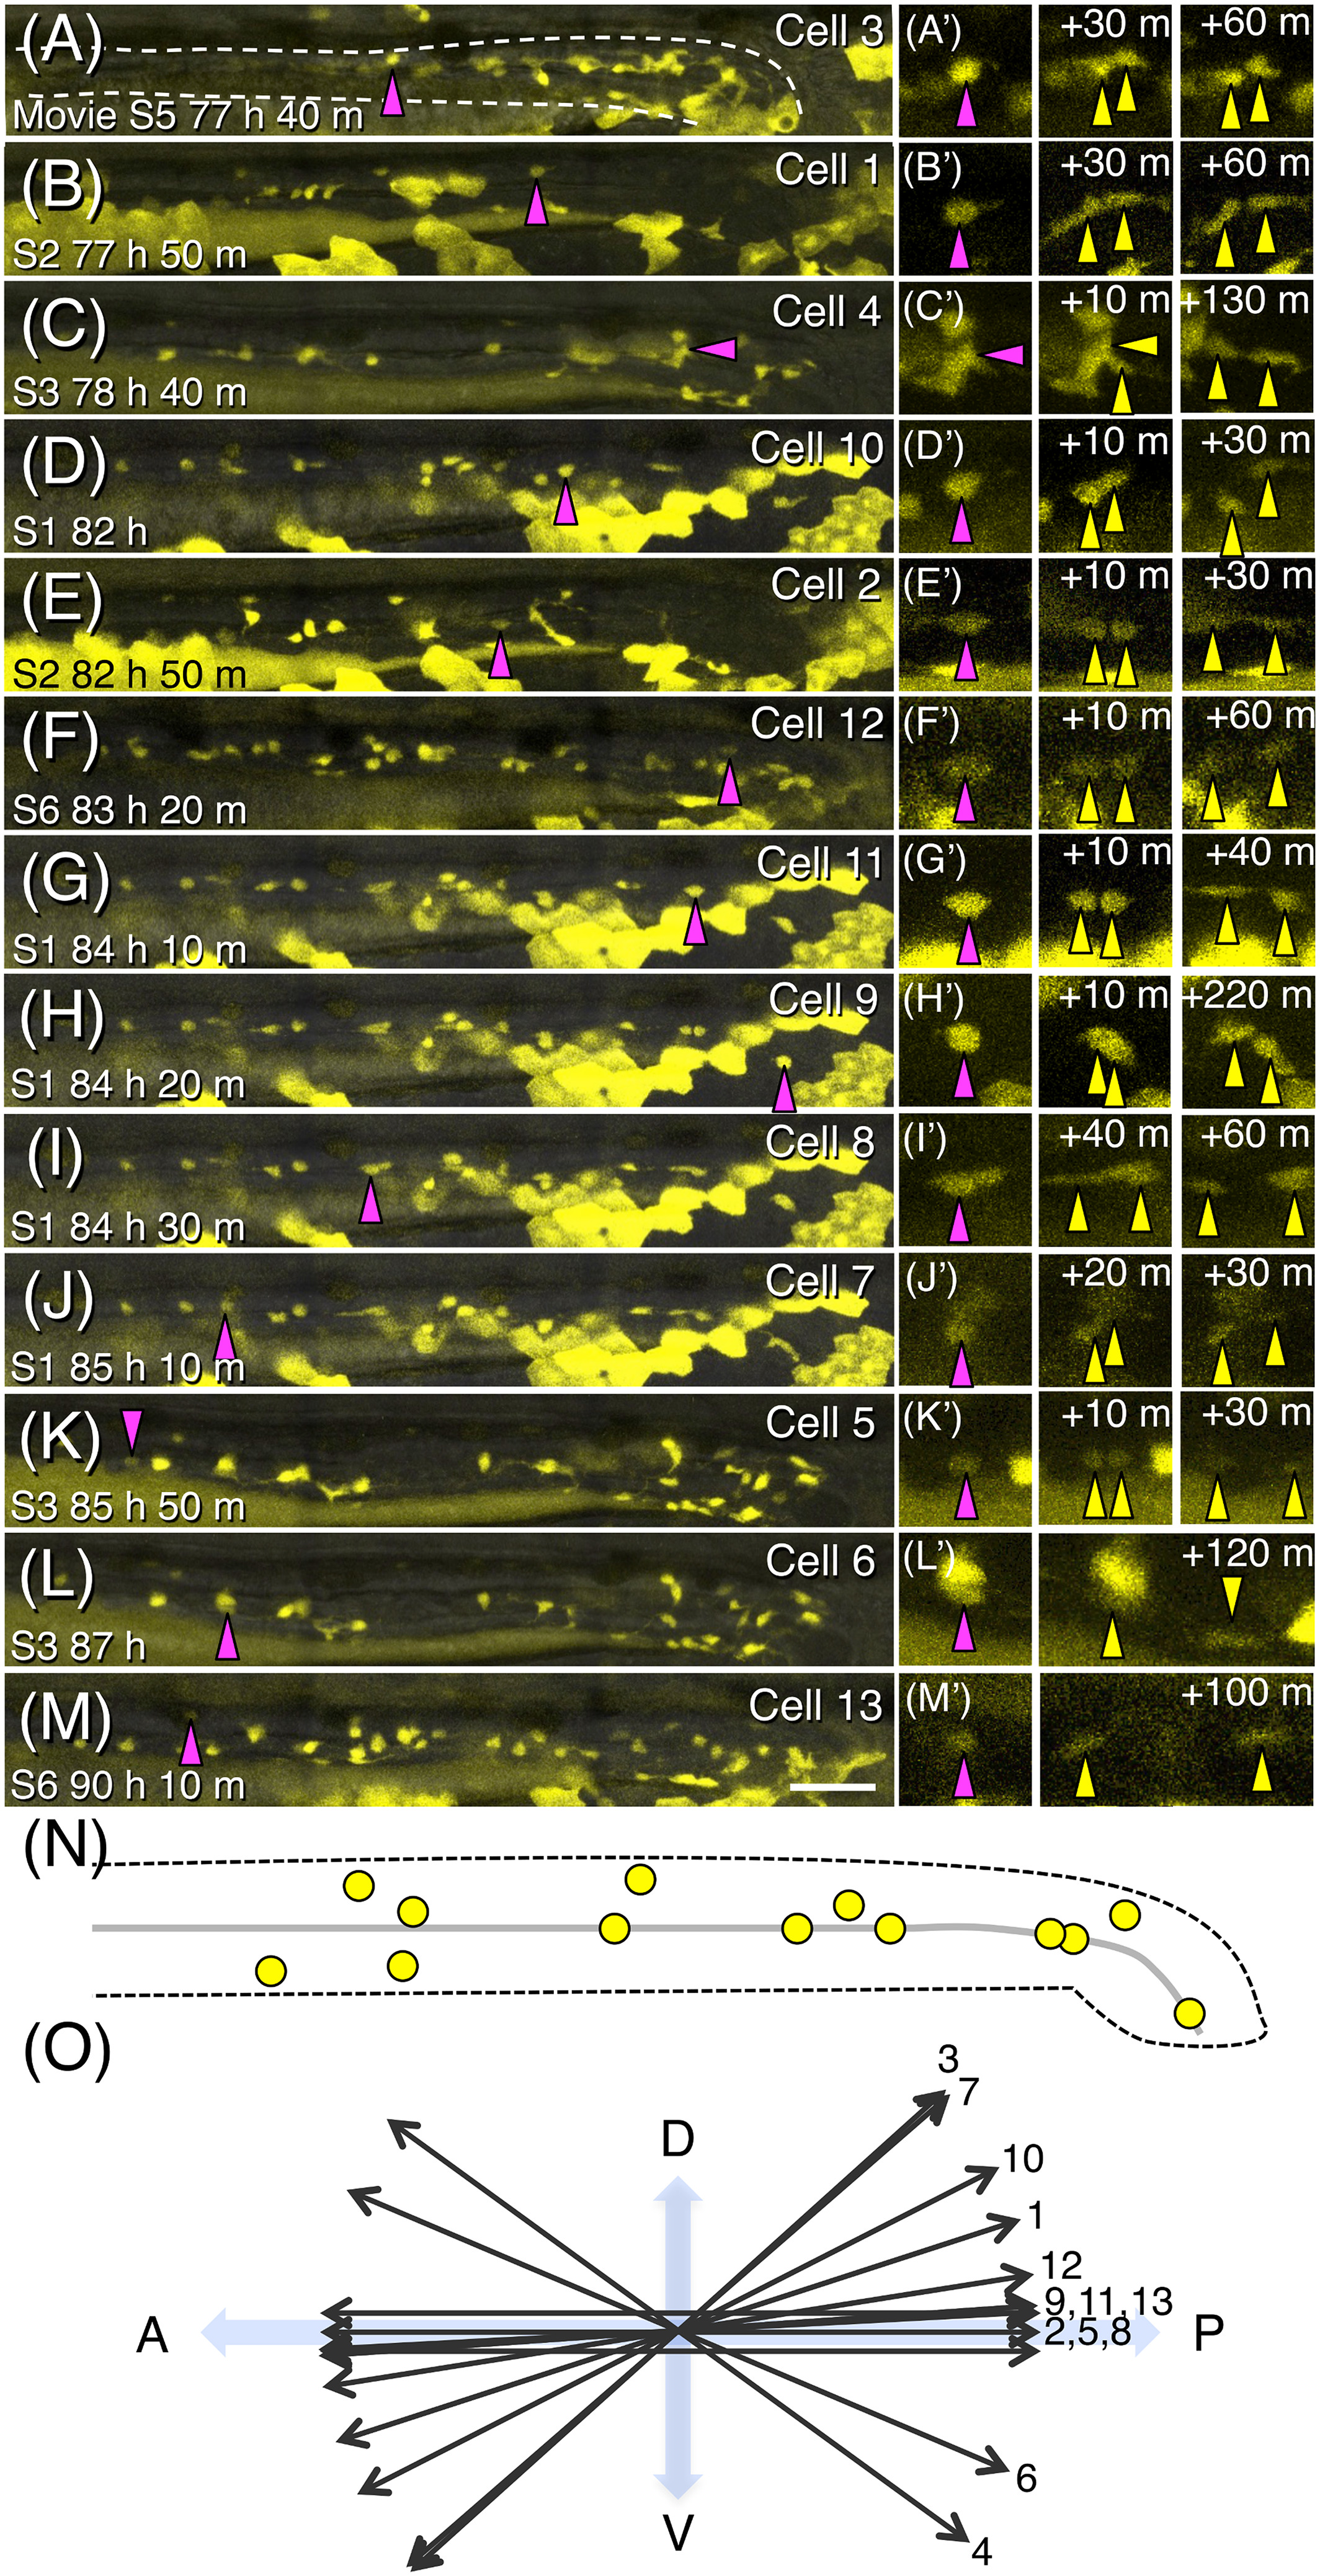
Fig. 4
Positions and orientations of neural crest cell divisions in the gut. A‐M, Projection images at the time of division prepared by using time‐lapse movies from five embryos in the posterior midgut and entire hindgut for 12‐29 hr between ca. 3 and 4 dpf. Images are aligned according to the developmental stage shown in the bottom‐left corners. Cell ID numbers are shown in the top‐right corners. The cells about to divide are indicated with magenta triangles, and their close‐up images (A′‐M′) and daughter cells (yellow triangles) at indicated time after division are shown in panels on the right. The white dashed line outlines the gut in (A). Scale bar = 50 μm. N, Schematic drawing of the positions of identified ENCC divisions. A black dashed line outlines the gut, and the grey line represents the position of the lumen. O, Summary of the orientation of each cell division