
|
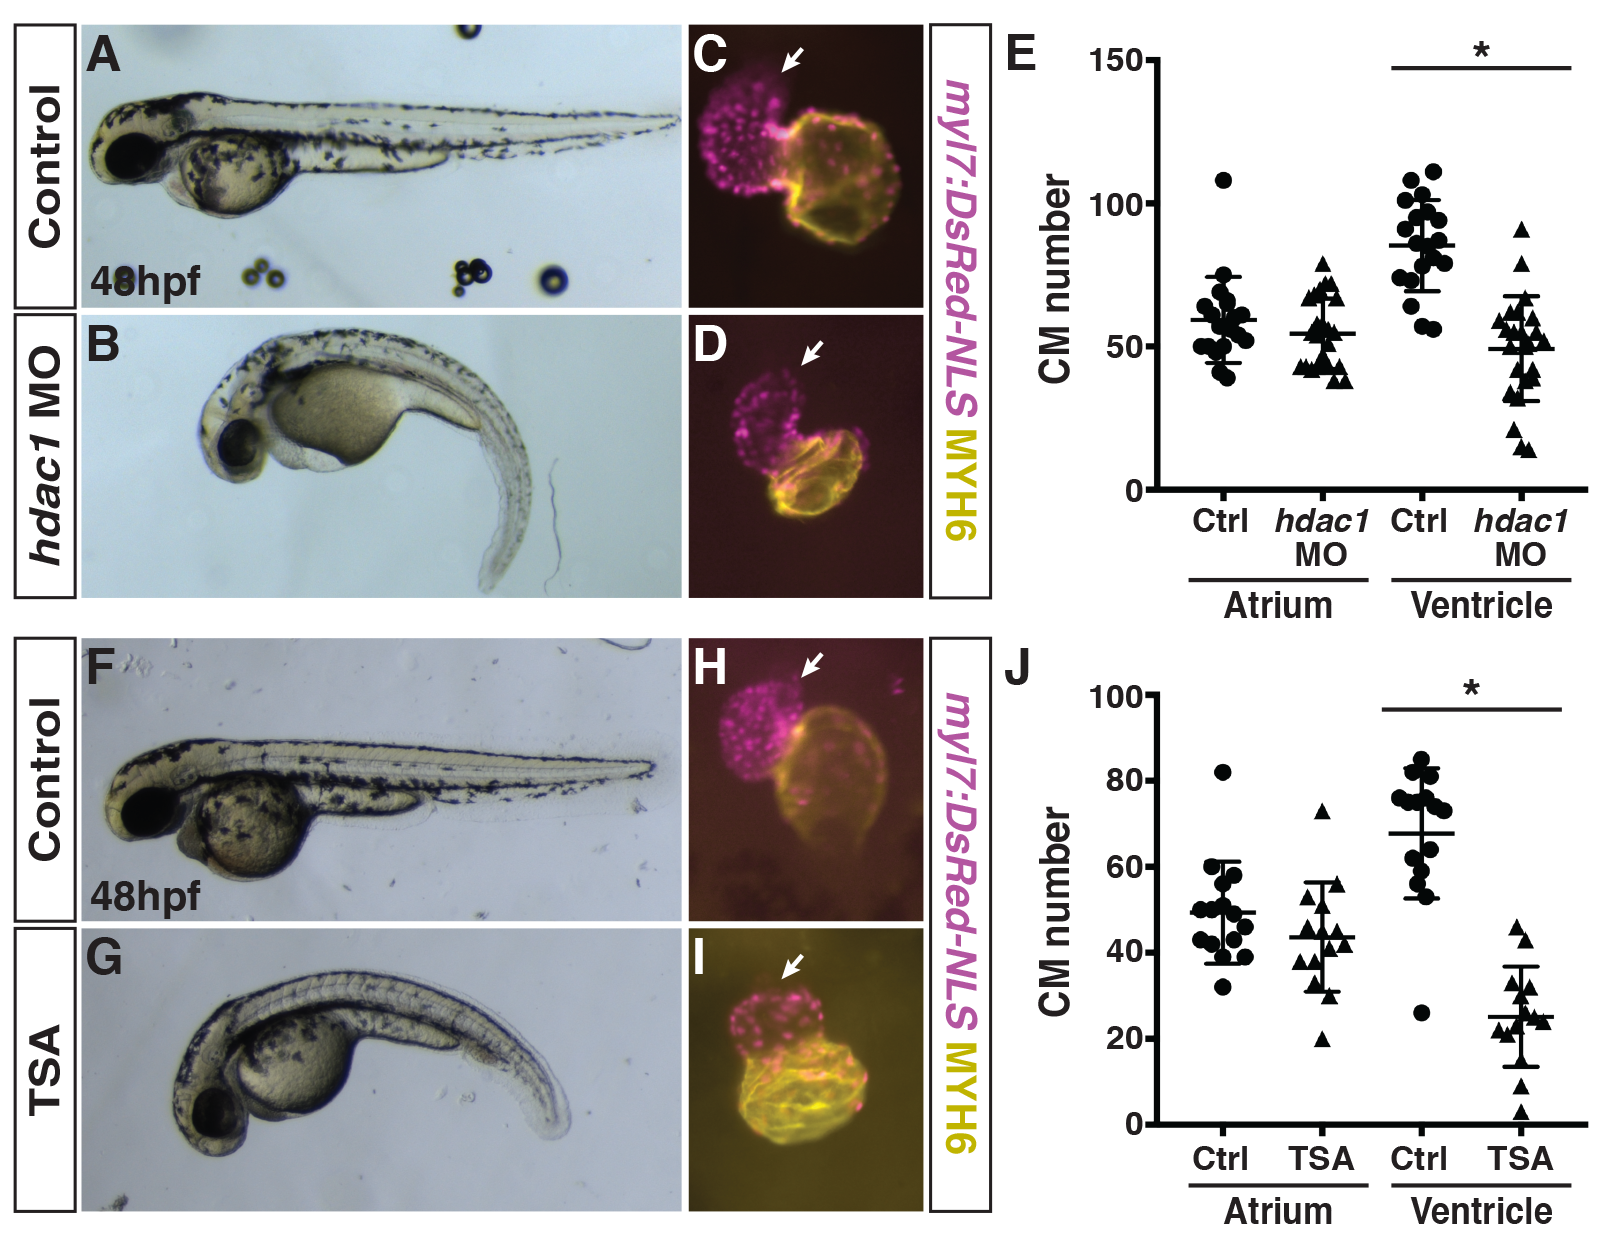
Fig. S5
Hdac1 depletion and treatment with TSA produce similar phenotypes as crgmutants.
(A,B) Control and Hdac1-depleted embryos at 48 hpf. Lateral views with anterior to the left. (C,D) Hearts from control and Hdac1-depleted myl7:NLS-DsRed2 embryos at 48 hpf. Frontal views. Purple alone indicates ventricle. Yellow indicates atrium. Arrows indicate arterial pole of the ventricle. (E) Quantification of CMs in the atria and ventricles of control and Hdac1-depleted myl7:NLS-DsRed2 embryos at 48 hpf (n = 19 for control and Hdac1-depleted embryos). (F,G) Control and TSA-treated embryos at 48 hpf. Lateral views with anterior to the left. (H,I) Hearts from control and TSA-treated myl7:NLS-DsRed2 embryos at 48 hpf. Frontal views. Purple alone indicates ventricle. Yellow indicates atrium. Arrows indicate arterial pole of the ventricle. (J) Quantification of CMs in the atria and ventricles of control and TSA-treated myl7:NLS-DsRed2 embryos at 48 hpf (n = 14 for both control and TSA-treated embryos).