
Image
|
Figure Caption
Fig. S1
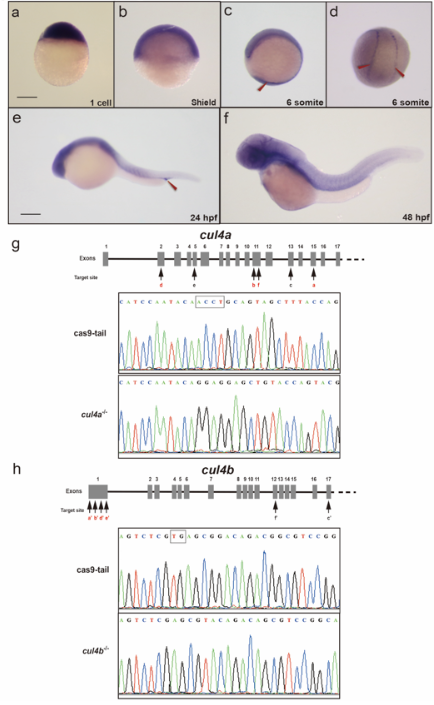
a-f Expression of cul4a was analyzed via WISH at 1 cell (a), 6 hpf (b), 12 hpf (c and d), 24 hpf (e) and 48 hpf (f) stages with the cul4a antisense probe. Red arrowheads indicate PLPM and ICM regions. Lateral views are shown with anterior to the left (c, e, f), and dorsal views are shown with anterior to the top (d). g Diagram of the target site in the zebrafish cul4a and cul4b genome. h Representative sequences from control and cul4a or cul4b mutants. All scale bars represent 250 μm.
Acknowledgments
This image is the copyrighted work of the attributed author or publisher, and
ZFIN has permission only to display this image to its users.
Additional permissions should be obtained from the applicable author or publisher of the image.
Full text @ Cell Death Dis.