
|
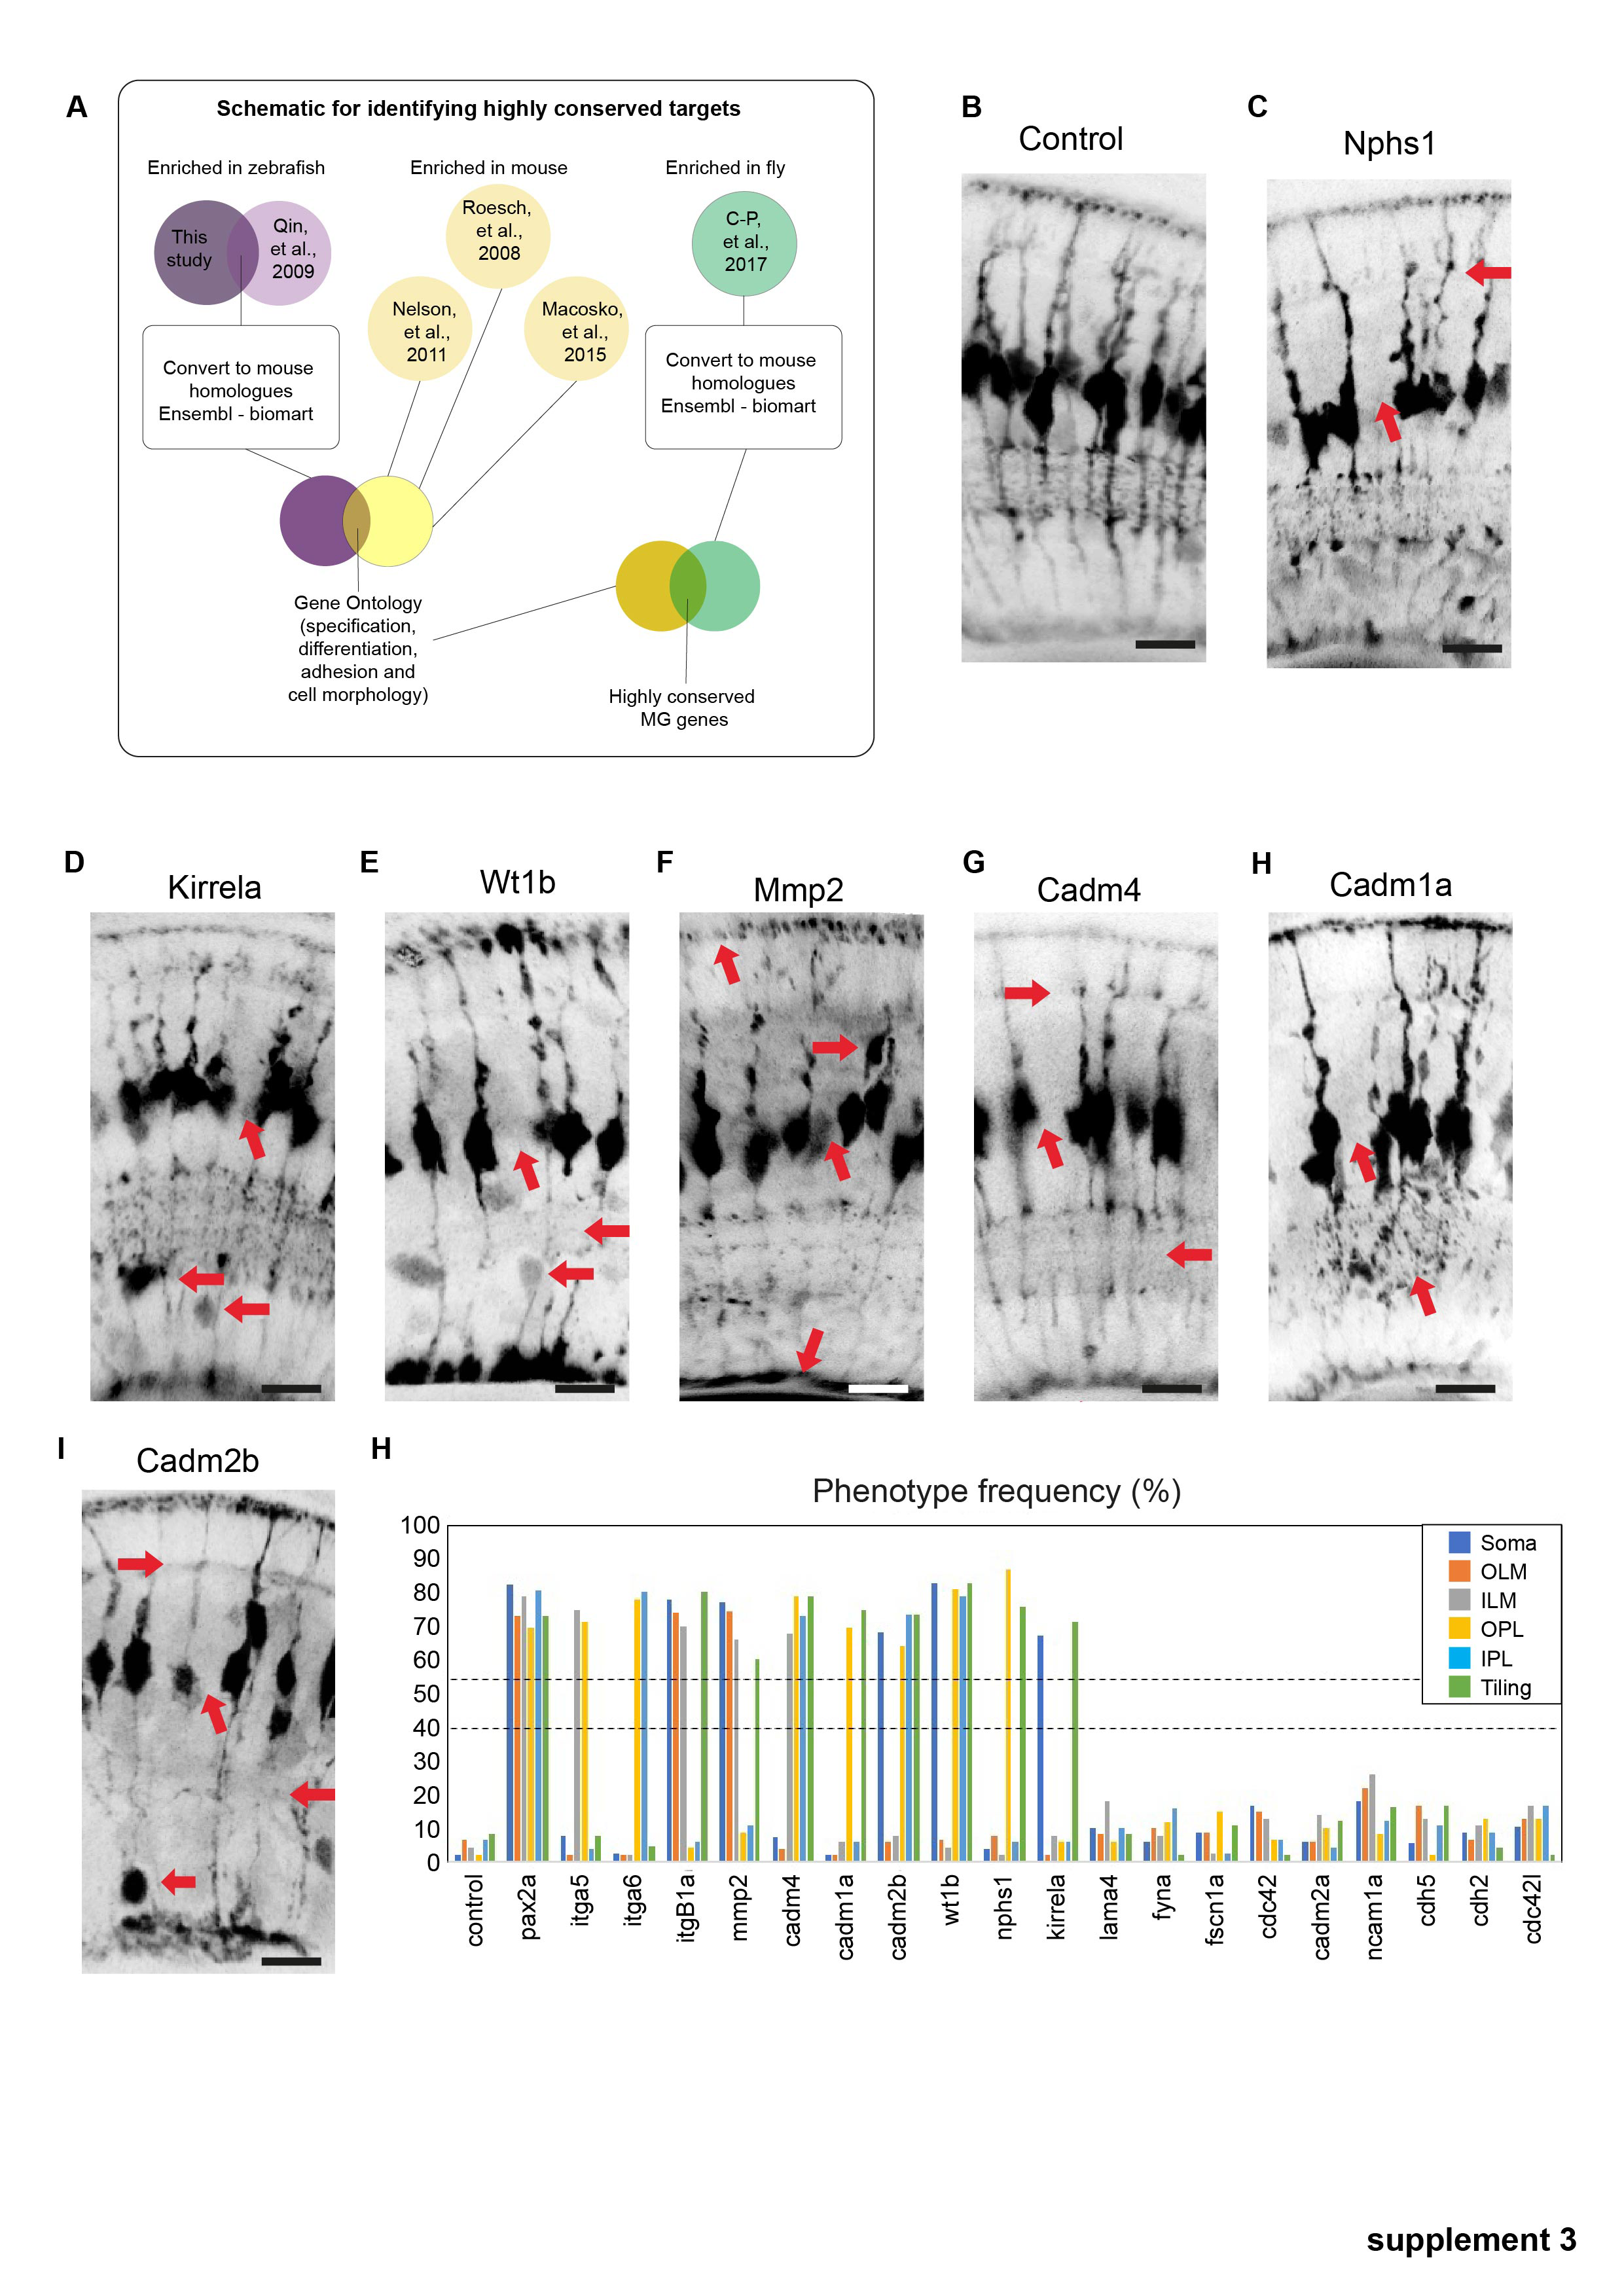
Figure S3
Phenotypes of conserved highly conserved MG cell genes. (a) Schematic representation of how highly conserved genes we bioinformatically identified. (b) slc45a5 controls have no observable MG phenotype. (b) timp2b mutants have defects in cell body position. (c) nphs1 mutants have defects in ILM, IPL, and tiling. (d) kirrela mutants have defects in cell body position and tiling. (e) wt1 mutants have defects in cell body position, IPL, OPL, and tiling. (f) mmp2 mutants have defects in OLM, ILM, and tiling. (g) cadm4 mutants have defects in OPL, IPL, ILM, and tiling. (h) Cadm1a mutants have defects in IPL and tiling. (i) cadm2b mutants have defects in a cell body positing, IPL OPL and tiling. (j–l) Percentages of individual phenotypes observed in all animals from this screen. Dashed lines represent levels of significance from Fisher's exact test after Boniforni multiple test correction (bottom = p < 0.05, top = p < 0.001). Scale bars = 8μm.