
Image
|
Figure Caption
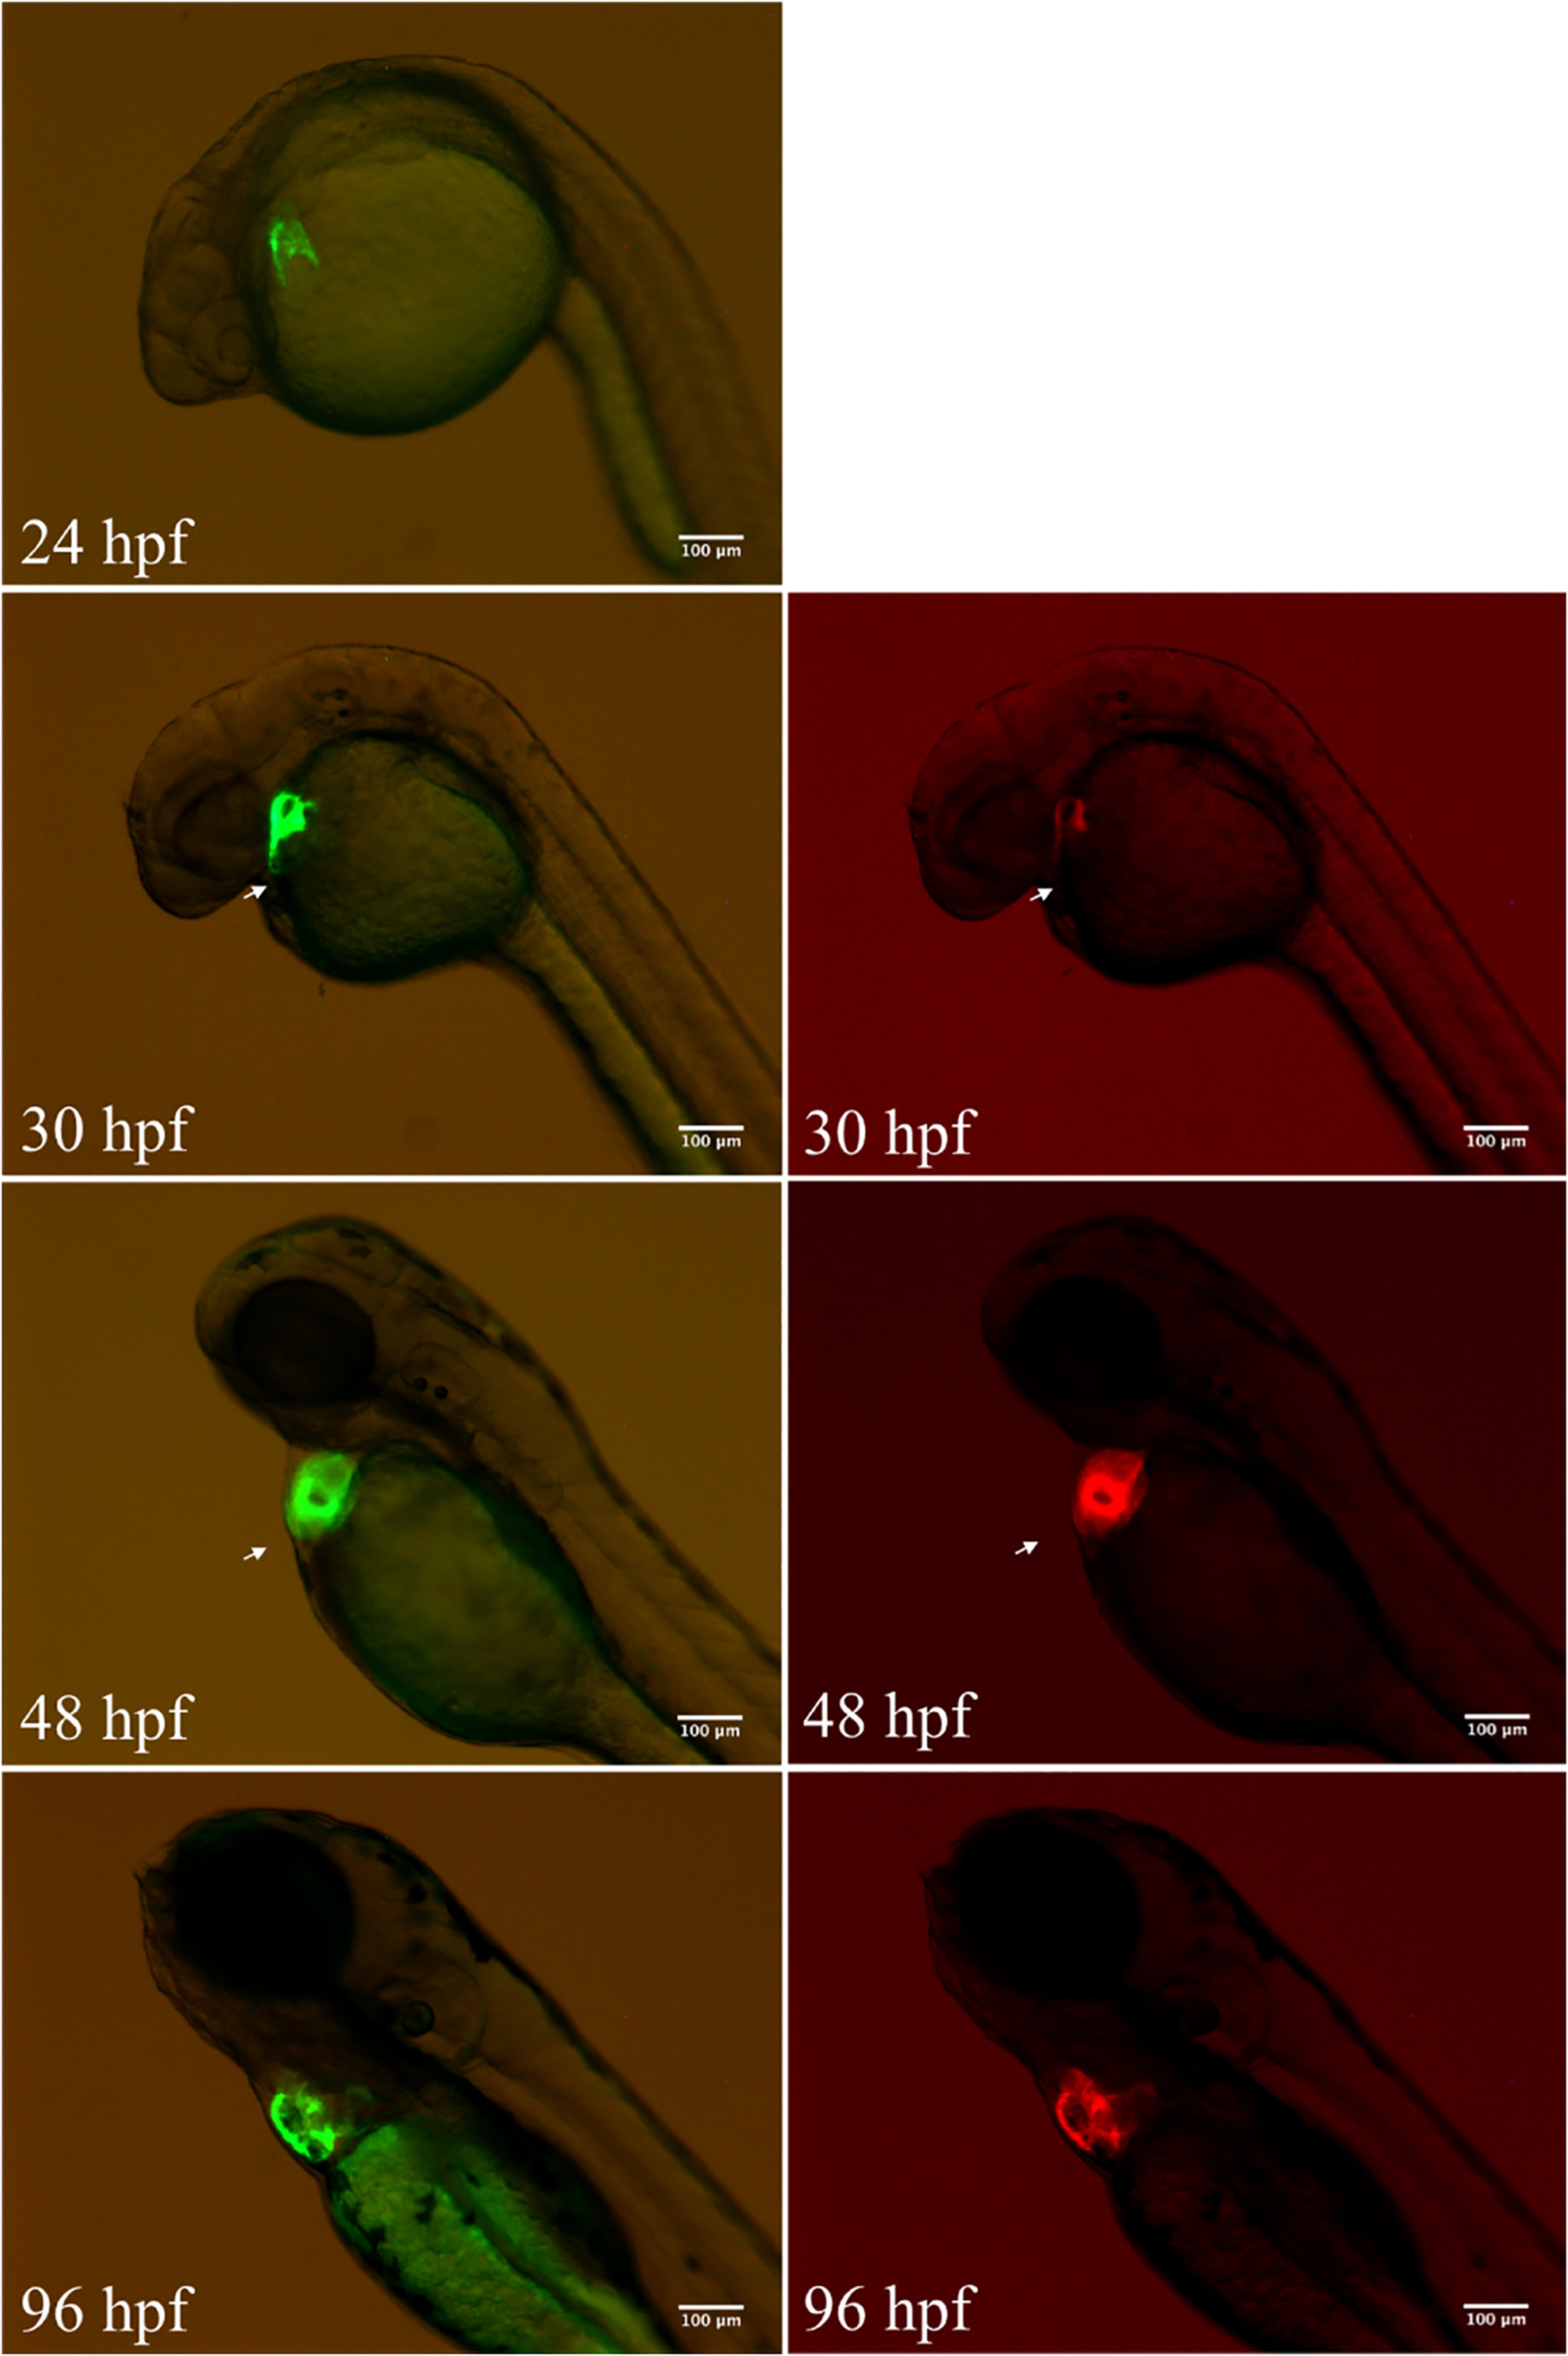
Fig. 5
Patterns of ECR3‐D2‐F2‐mediated GFP expression and cmlc2 promoter‐mediated mCherry expression at different stages. Images in the left column show the GFP channel and right columns with the RFP channel. Scale bars = 100 μm in all panels
Figure Data
Acknowledgments
This image is the copyrighted work of the attributed author or publisher, and
ZFIN has permission only to display this image to its users.
Additional permissions should be obtained from the applicable author or publisher of the image.
Full text @ Dev. Dyn.