
|
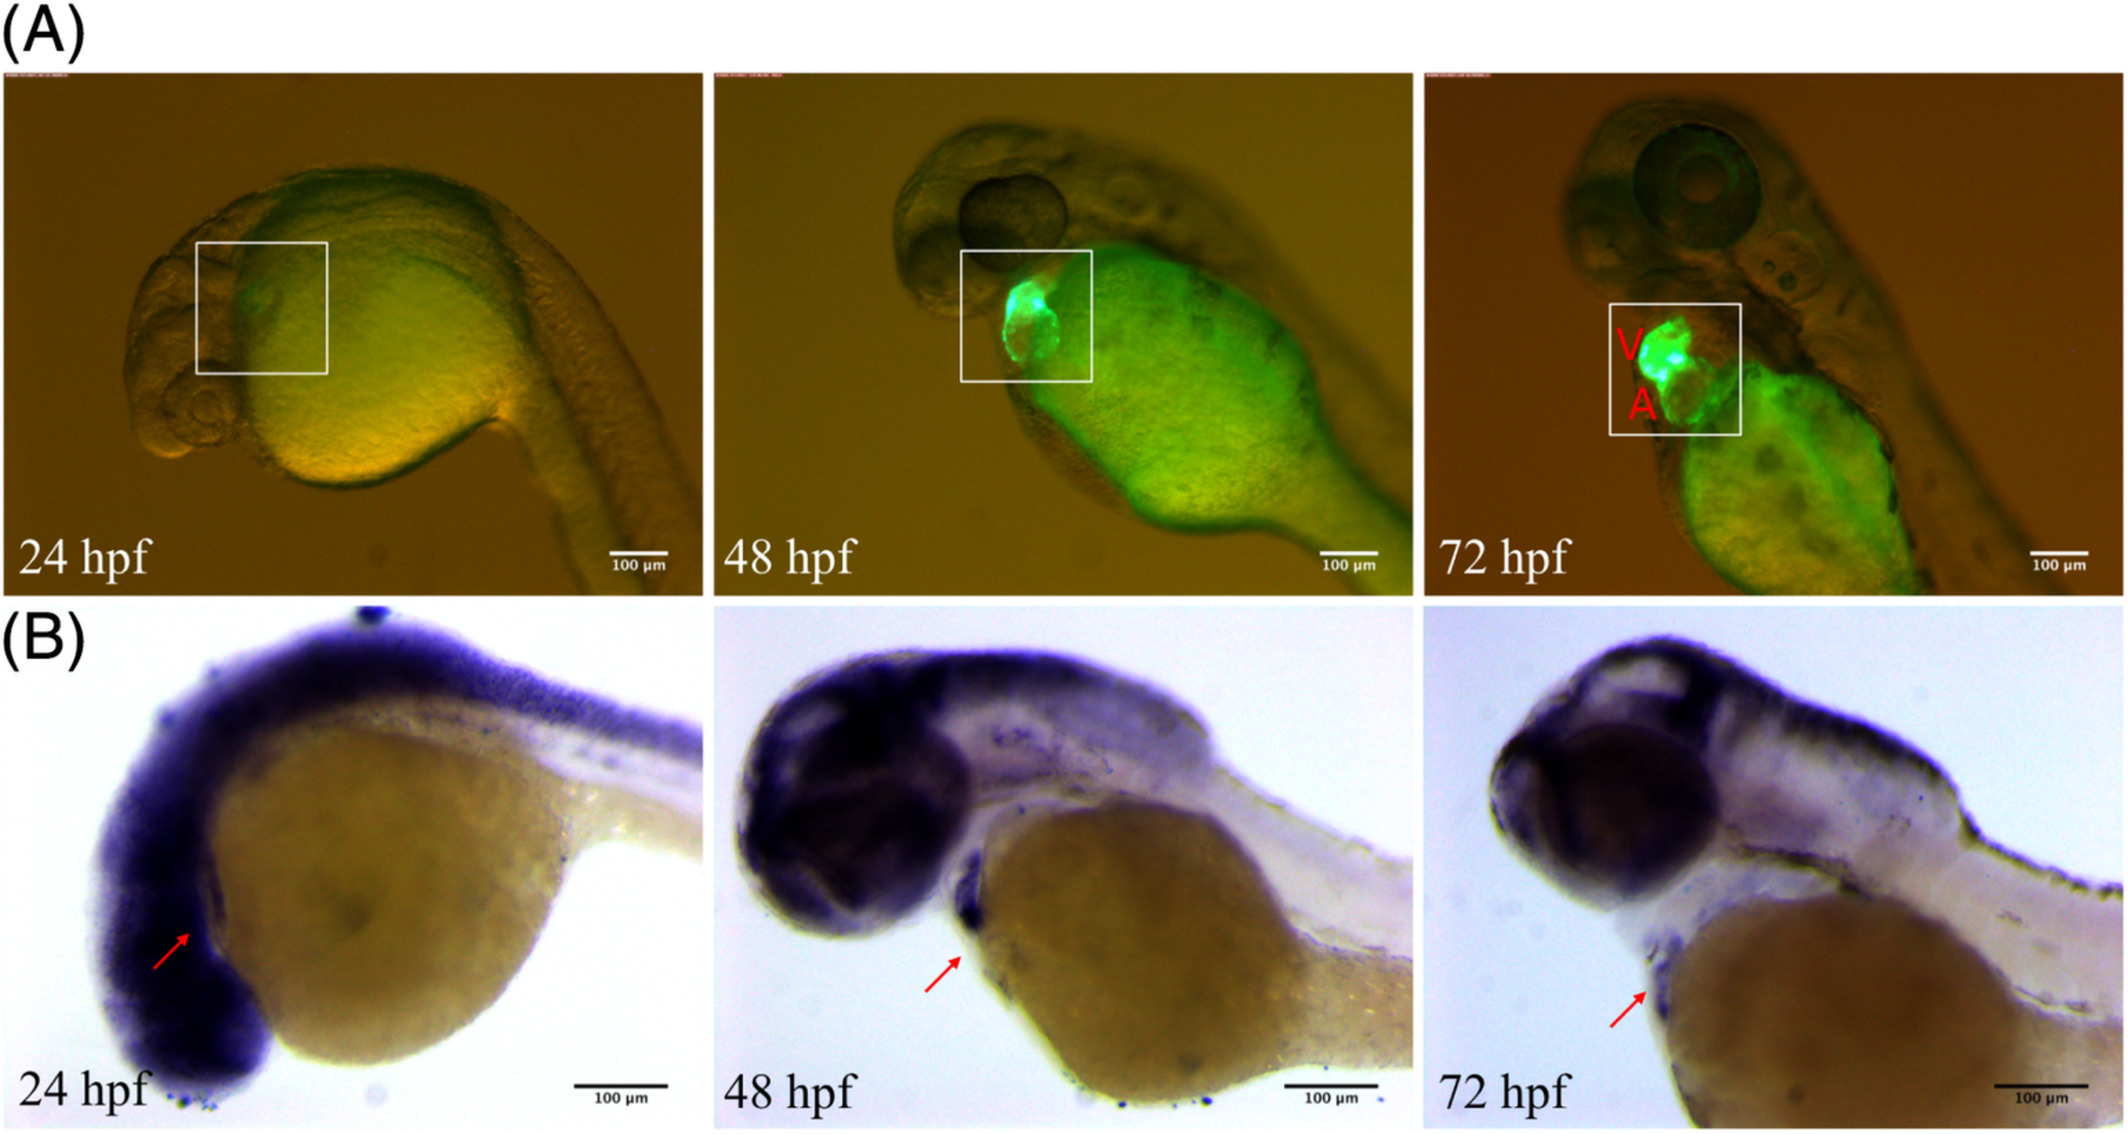
Fig. 3
Expression comparison between embryos from ECR3‐D2‐F2 zebrafish and in situ hybridization of the notch1b gene in wild‐type embryos. A, ECR3‐D2 drives GFP expression specifically in the heart at 24 hpf, 48 hpf, and 72 hpf. All images were obtained with an inverted microscope. White boxes indicate the position of the zebrafish heart. A, atrium; V, ventricle. Scale bars = 100 μm in all panels. B, In situ hybridization of the notch1b gene in wild‐type embryos at 24 hpf, 48 hpf, and 72 hpf. All photos were taken with the light channel in a lateral position. Red arrow indicates the location of the heart. Scale bars = 100 μm in all panels