
|
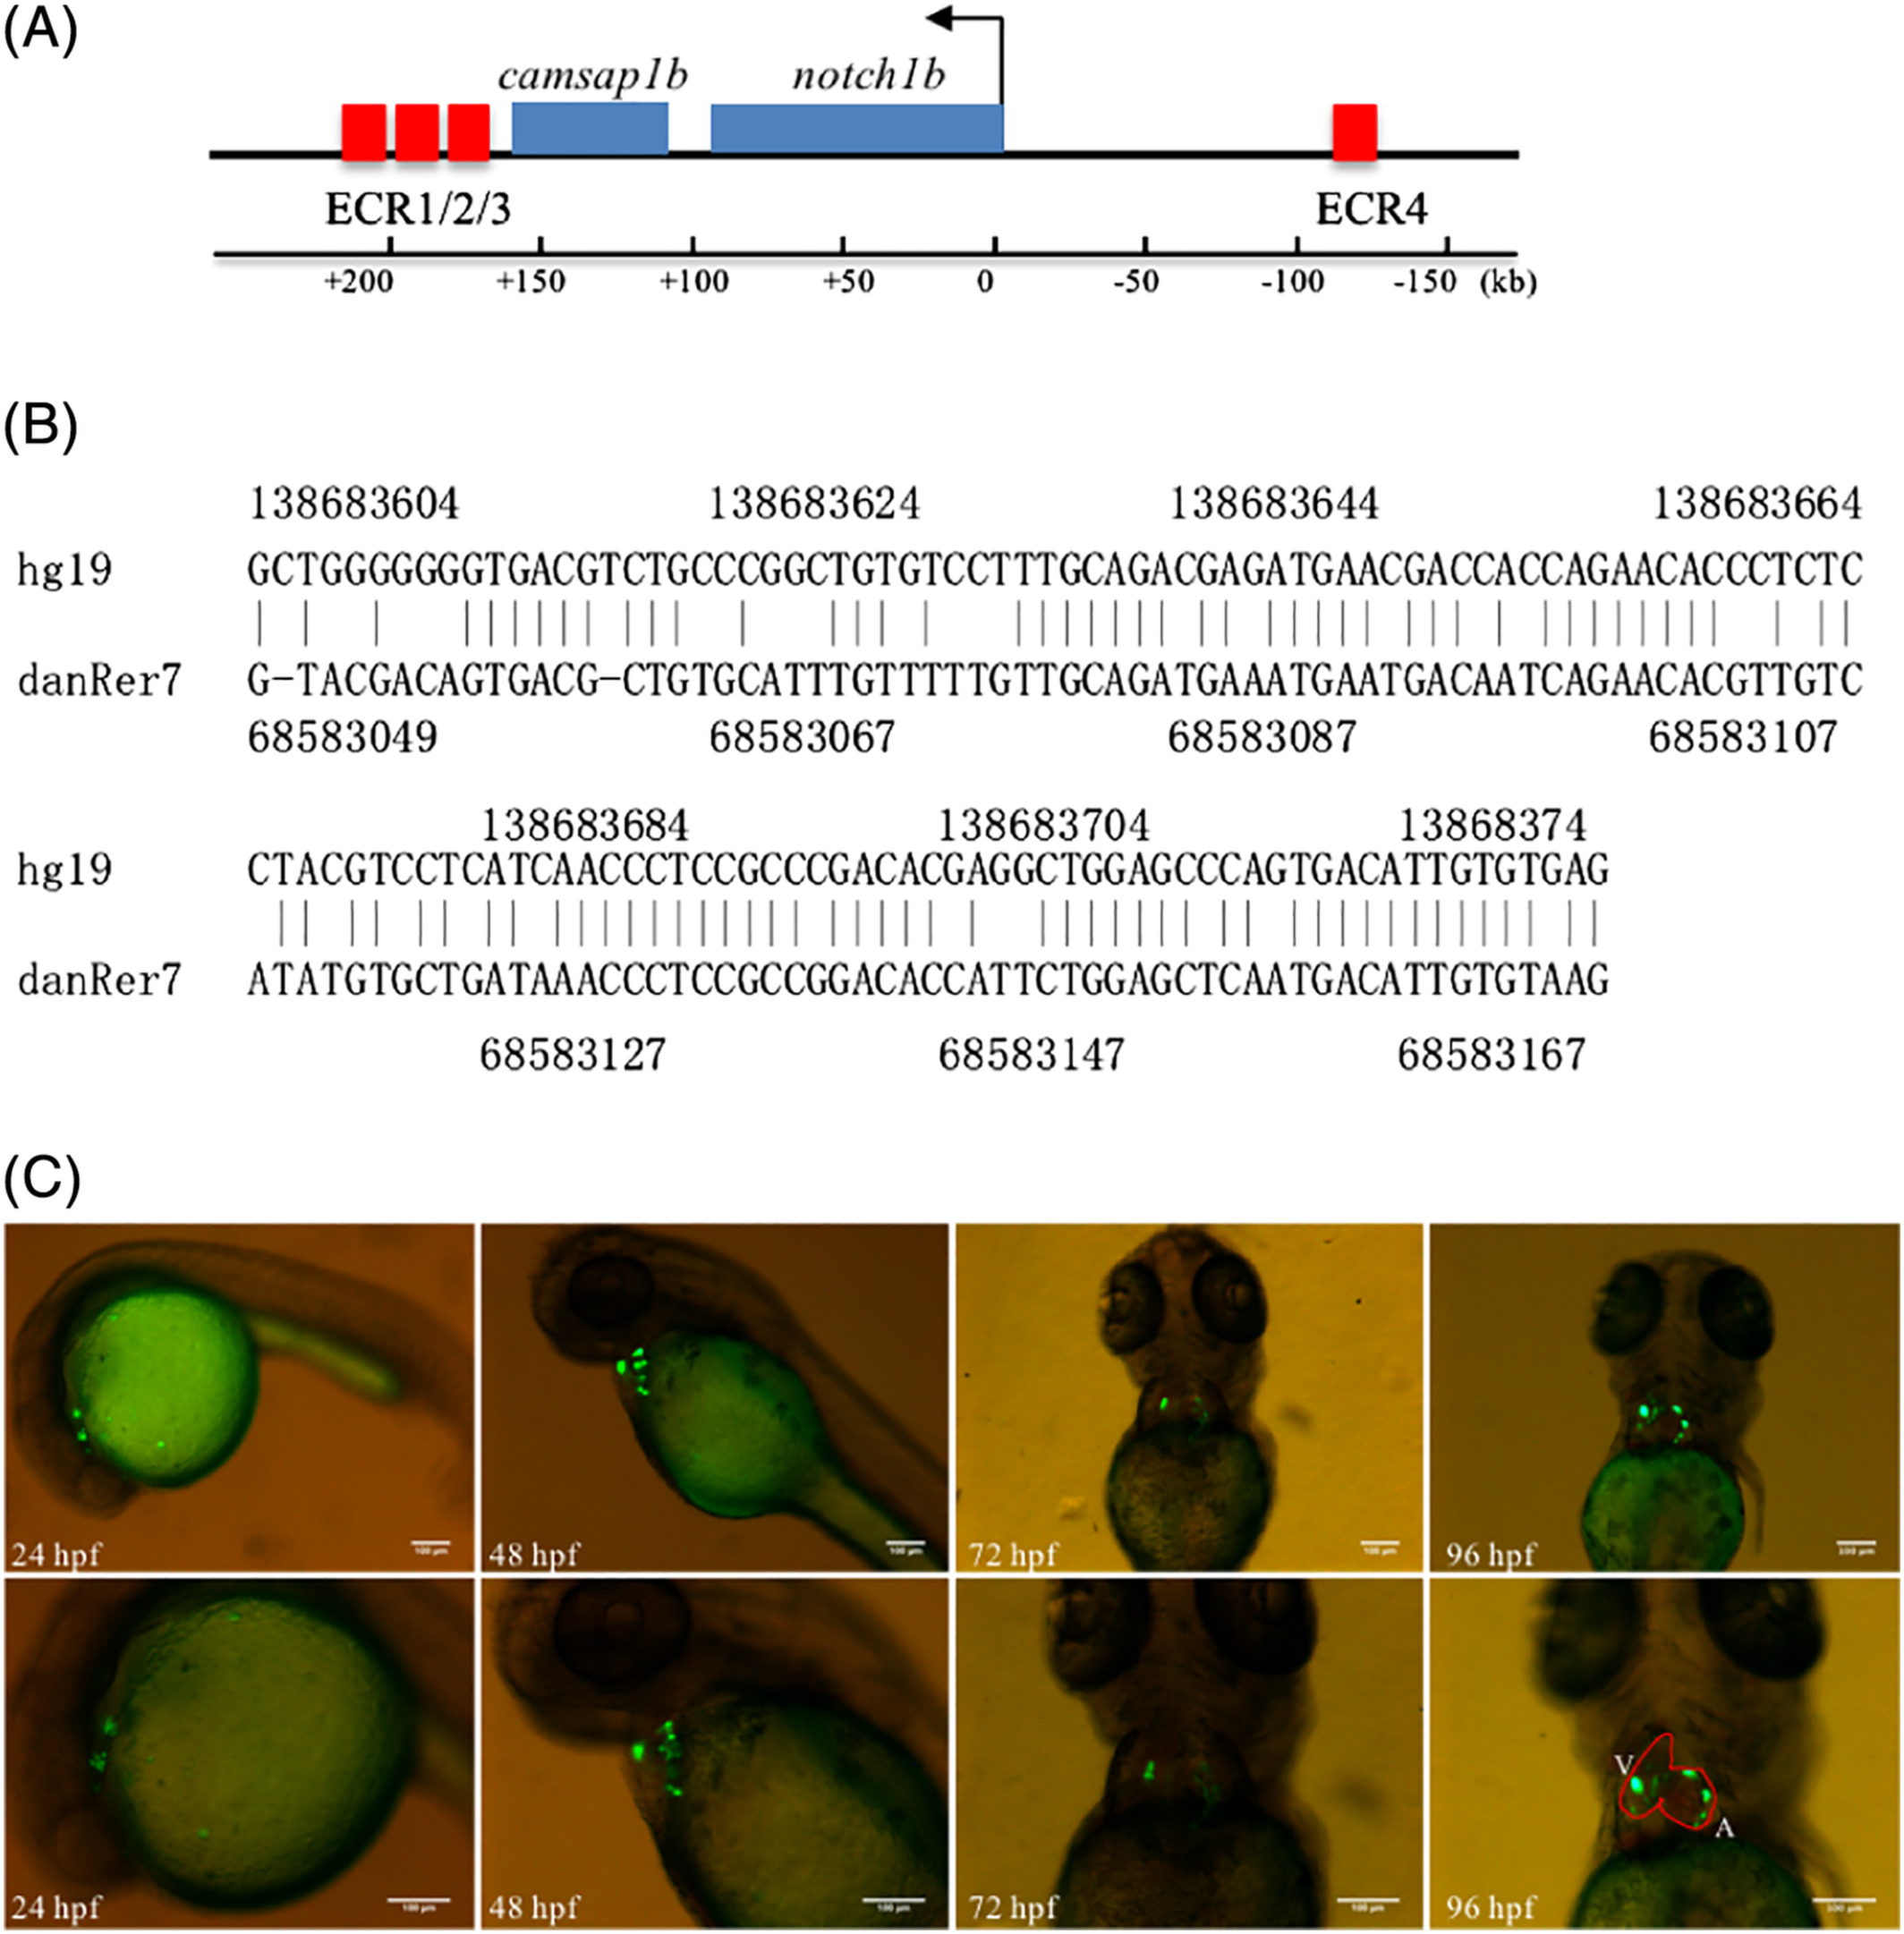
Fig. 1
Identification of heart‐specific enhancers around notch1b. A, ECR distribution near the zebrafish notch1b locus based on the danRer7 assembly. Genes are shown as blue rectangles and the orientation of arrows indicate the translational initiation sites of genes. The ECRs located near the notch1b gene are indicated by red rectangles. The horizontal line at the bottom indicates the studied range of the DNA sequence range. B, Sequence conservation between zebrafish (danRer7 assembly) and humans (hg19 assembly). C, ECR3 regulates GFP expression mainly in zebrafish heart. Photos were taken with the GFP channels in the lateral position at 24 hpf and 48 hpf and supine position at 72 hpf and 96 hpf. The images below show an enlarged view of the above embryos. Red curve: outline of the heart; A, atrium; and V, ventricle. Scale bars = 100 μm in all panels