
Image
|
Figure Caption
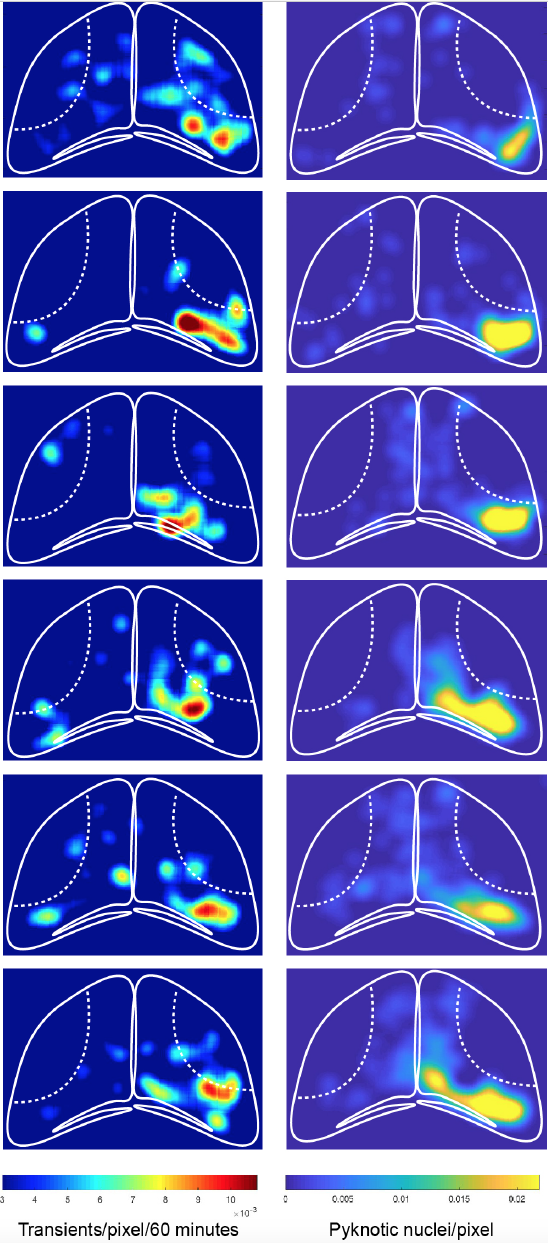
Fig. S5
The spatial pattern of calcium transients correlates with regions of cell death. Heat maps illustrating the spatial distribution of calcium transients occurring between 2 and 3 hpi (left), and of pyknotic nuclei at 3 hpi (right), in the same animals.
Acknowledgments
This image is the copyrighted work of the attributed author or publisher, and
ZFIN has permission only to display this image to its users.
Additional permissions should be obtained from the applicable author or publisher of the image.
Full text @ Development