
|
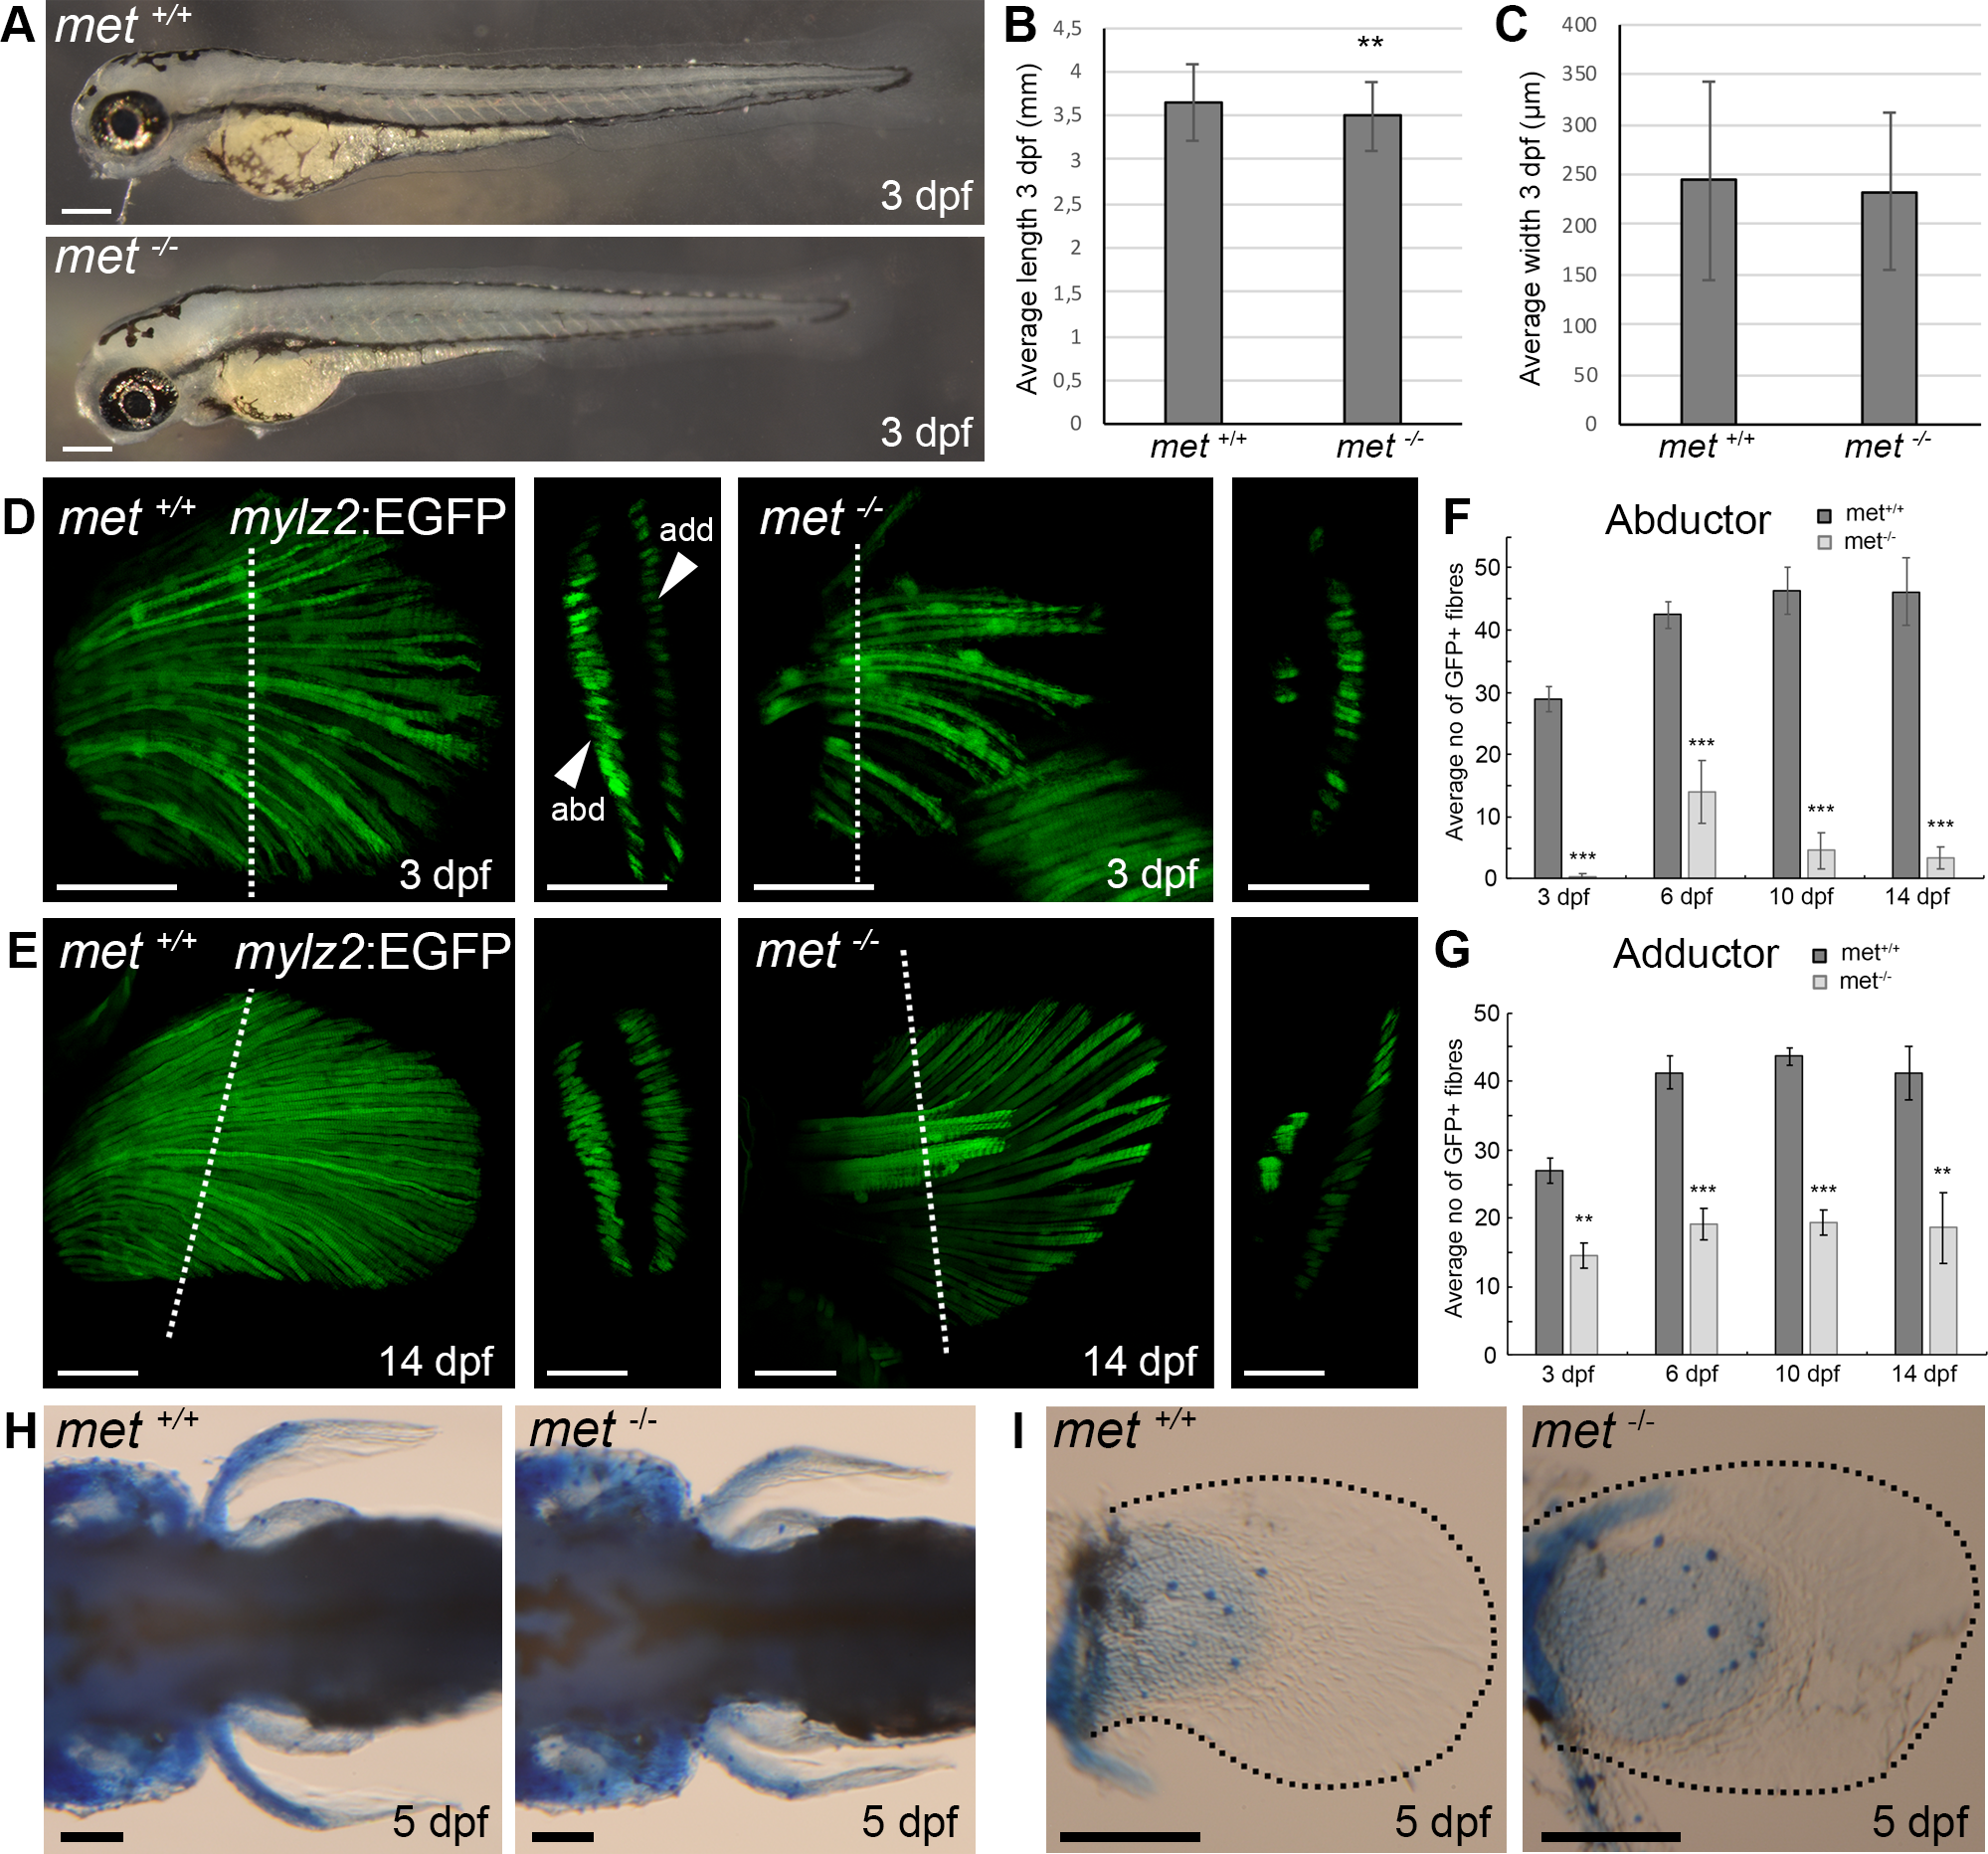
Fig. 3
(A) Lateral view of met+/+ and met-/- embryos at 3 dpf. (B) Average anterior-posterior length of embryo and (C) average myotome dorsal-ventral width at the level of the most posterior part of the yolk extension of met+/+ (n = 6) and met-/- (n = 5) embryos at 3 dpf. (D) Transgenic expression of mylz2:EGFP in the pectoral fin of met+/+ siblings and met-/-mutant zebrafish embryos at 3 dpf, dashed line indicate area of transverse section presented to the right, which shows the two separate abductor and adductor muscles of the pectoral fin. (E) Transgenic expression of mylz2:EGFP in the pectoral fin of met+/+siblings and met-/- mutant zebrafish at 14 dpf, dashed line indicate area of transverse section presented to the right, which shows the two separate abductor and adductor muscles of the pectoral fin. Average number of mylz2:EGFP+ fibers in the pectoral (F) abductor and (G) adductor fin muscle of different met+/+ siblings (dark grey) and met-/-mutant (light grey) zebrafish at 3 dpf (n = 6 for met+/+ and n = 5 for met-/-), 6 dpf (n = 5 and n = 5), 10 dpf (n = 5 and n = 5) and 14 dpf (n = 6 and n = 5). Error bars indicate S.E.M. Significance was calculated using students t-test where p<0.05 was considered significant, * p<0.05, ** p<0.01, *** p<0.001. (H) Dorsal view and (I) enlargement of pectoral fin of met+/+ siblings (n = 5) and met-/- mutant (n = 5) embryos at 5 dpf stained with alcian blue to visualize cartilage, dashed black lines outline pectoral fins. Abbreviations: add: adductor; abd: abductor. Scale bars: A: 200 μm, D-E: 50 μm, H-I:100 μm.