IMAGE

Figure 4

ID
ZDB-IMAGE-190726-13
Source
Figures for Silbernagel et al., 2018
Image
Figure Caption

Figure 4

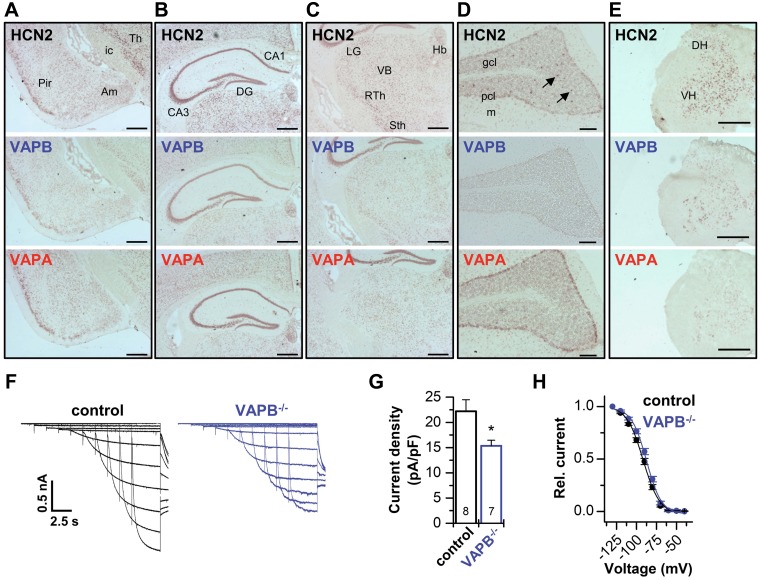
Codistribution of VAPs with HCN2 and contribution to thalamic Ih. AE), Distribution of HCN2, VAPB, and VAPA mRNA in mouse brain and spinal cord. ISH analysis of HCN2, VAPB, and VAPA using DIG-labeled riboprobes, revealing mRNA expression of VAPB in cortical areas (A), hippocampus (B), thalamus (C), cerebellum (D) (arrows point to interneurons in the granular layer), and spinal cord (E). Note the overlapping distribution of VAPB with HCN2 and VAPA mRNA. Am, amygdala; CA, cornu ammonis; DG, dentate gyrus; DH, dorsal horn; gcl, granule cell layer; Hb, habenulae; ic, internal capsule; LG, lateral geniculate ncl.; m, molecular cell layer; pcl, Purkinje cell layer; RTh, reticular thalamic ncl.; Sth, subthalamic ncl.; VB, ventrobasal thalamus; Th, thalamus; VH, ventral horn. F) Representative current traces elicited in slice patch-clamp experiments of the ventrobasal thalamus (VB) of wild-type animals (control) and VAPB−/− mice. G) The Ih current was significantly reduced in VAPB−/− mice (15.4 ± 1.1 pA/pF) compared with control animals (22.2 ± 2.3 pA/pF). H) Average activation curves of the VB Ih current for control and VAPB−/− mice. V1/2 of activation for control (−91.6 ± 1.3 mV, n = 8) and VAPB−/− (−87.5 ± 1.2 mV, n = 7). Scale bars: 500 µm (A–C, E), 100 µm (D). All data are presented as means ± sem. The number of experiments (n) is indicated in the respective bar graphs. *P < 0.05 (unpaired Student’s t test).

Acknowledgments
This image is the copyrighted work of the attributed author or publisher, and ZFIN has permission only to display this image to its users. Additional permissions should be obtained from the applicable author or publisher of the image. Full text @ FASEB J.