IMAGE

Figure 3

ID
ZDB-IMAGE-190726-12
Source
Figures for Silbernagel et al., 2018
Image
Figure Caption

Figure 3

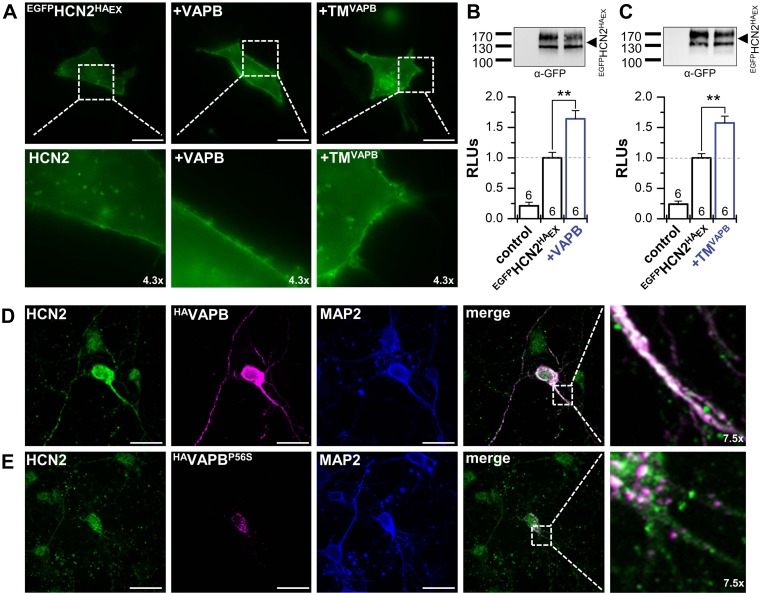
VAPB determines surface expression and dendritic localization of HCN2. A) Live cell imaging of HeLa cells transfected with an N-terminally EGFP-tagged HCN2 carrying an extracellular HA-epitope (EGFPHCN2HAEx) alone or cotransfected with VAPB or the TM segment of VAPB (TMVAPB). B) Chemiluminescence assays of fixed non-permeabilized HeLa cells, analyzing the surface expression as relative light units (RLUs) for EGFPHCN2HAEx alone and after cotransfection with VAPB (1.6 ± 0.1). Upper inset illustrates a representative control Western blot showing an unaltered HCN2 protein expression. C) Chemiluminescence surface expression assay as in B, but using TMVAPB (1.6 ± 0.1). D) Immunocytochemistry of HAVAPB transfected cortical neurons. Endogenous HCN2 (green) is colocalizing (white) with HAVAPB (magenta) in the soma and dendrites. Anti–MAP2-staining illustrating an intact neuronal network and dendrites (blue). E) Immunocytochemistry experiment as in D, but transfecting the ALS8 mutation HAVAPBP56S (magenta), leading to an aggregation of VAPBP56S in the soma of the neurons. Also, HCN2 fluorescence (green) was focused in the soma and dendritic localization was lost, despite an intact neuronal network (α-MAP2, blue). Scale bars, 20 µm (A, D, E). All data are presented as means ± sem. The number of experiments (n) is indicated in the respective bar graphs. **P < 0.01 (unpaired Student’s t test).

Acknowledgments
This image is the copyrighted work of the attributed author or publisher, and ZFIN has permission only to display this image to its users. Additional permissions should be obtained from the applicable author or publisher of the image. Full text @ FASEB J.