
Figure 3—figure supplement 2.
- ID
- ZDB-IMAGE-190723-961
- Genes
- Source
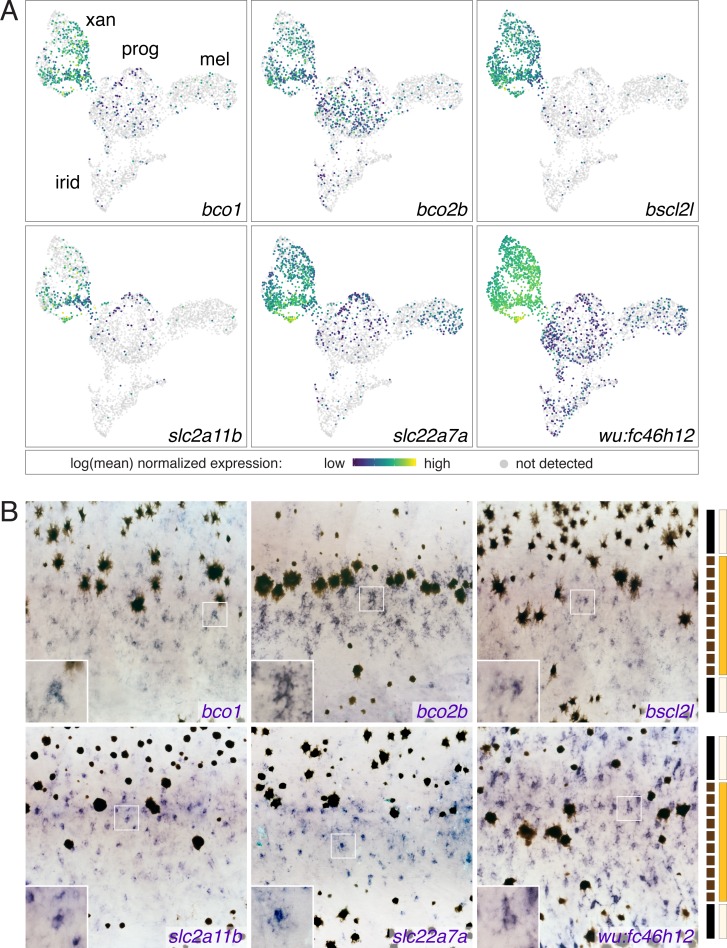
- Figures for Saunders et al., 2019
|
Figure 3—figure supplement 2.
(