IMAGE

Fig 8

ID
ZDB-IMAGE-190723-839
Genes
Antibodies
Source
Figures for Song et al., 2019
Image
Figure Caption

Fig 8 Loss of <italic>ripply3</italic> in <italic>crg</italic> mutants partially restores VC number.

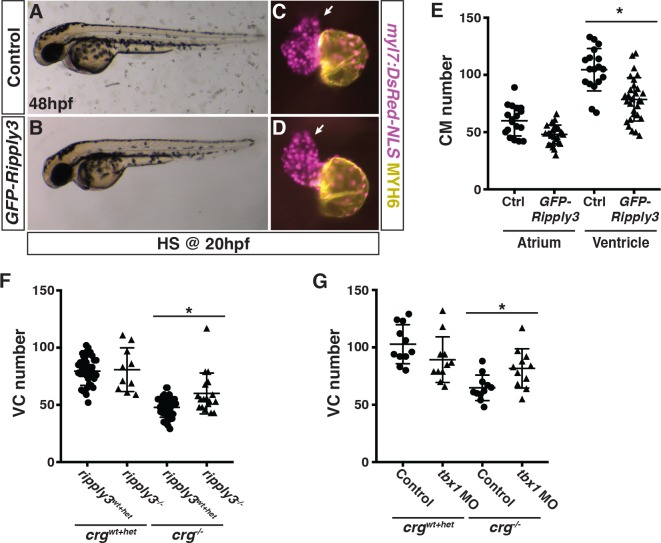
(A,B) Control and transgenic hsp70l:GFP-ripply3 embryos at 48 hpf following heat-shock at 20 hpf. (C,D) Hearts from control and hsp70l:GFP-ripply3 transgenic embryos with the myl7:DsRed2-NLS transgene at 48 hpf following heat-shock at 20 hpf. Purple alone indicates ventricle. Yellow indicates atrium. Arrows indicate arterial pole of the ventricle. (E) Quantification of CMs in control and hsp70l:GFP-ripply3 transgenic embryos at 48 hpf following GFP-ripply3 induction at 20 hpf (n = 18 for control, n = 29 for GFP-ripply3+). (F) Quantification of VCs in crgwt+het; ripply3wt+het, crgwt+het; ripply3-/-, crg-/-; ripply3wt+het, and crg-/-; ripply3-/- embryos at 48 hpf (n = 37 for crgwt+het; ripply3wt+het, n = 10 for crgwt+het; ripply3-/-, n = 48 for crg-/-; ripply3wt+het, n = 18 for crg-/-; ripply3-/-). (G) Quantification of VCs in WT (crgwt+het—uninjected) sibling, crgwt+het–Tbx1 depleted, crg-/-uninjected, and crg-/-Tbx1-depleted embryos at 48 hpf (n = 11 for crgwt+hetcontrol uninjected, n = 10 for crgwt+het–Tbx1-depleted, n = 10 for crg-/-control uninjected, n = 10 for crg-/-Tbx1-depleted). For all CM quantification, embryos contained the myl7:DsRed2-NLS transgene.

Figure Data
Acknowledgments
This image is the copyrighted work of the attributed author or publisher, and ZFIN has permission only to display this image to its users. Additional permissions should be obtained from the applicable author or publisher of the image. Full text @ PLoS Genet.