
|
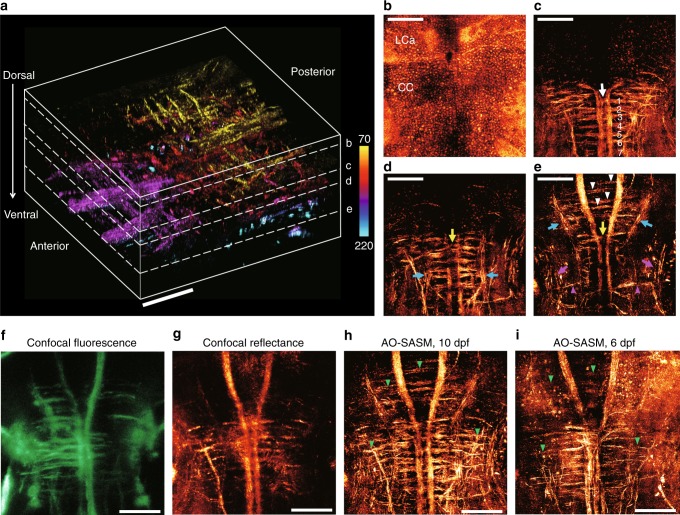
Fig. 3
3D neuroanatomy encompassing the deep hindbrain of a living zebrafish. a 3D rendering of the aberration-corrected tomographic images ranging from 70 to 220 μm in depth at the hindbrain of a 10-dpf larval zebrafish. The wavelength of the light source was 633 nm. The scale bar represents 50 μm. Color bar indicates depth from the surface. b–eMIP images at a depth centered on each plane indicated by the white dashed lines in (a). The scale bar represents 50 μm. b The en-face cellular distributions. MIP image ranging from 70 to 75 μm in dorsal depth. c The subset of neural networks. MIP image in the depth range of 112.5 to 135 μm. The white arrow indicates the crossed axons of Mauthner cells, and the labels ranging from 1 to 7 indicate a series of seven ladder-like commissural tracts in the caudal hindbrain. d MIP image ranging from 135 to 145 μm. eMIP image ranging from 150 to 220 μm. The yellow arrows in (d, e) indicate two prominent commeasures in rhombomere 3. The blue arrows indicate the ipsi- and contra-lateral projections. The white arrowheads in (e) indicate commissural tracts connected to the anterior medial projections. The magenta arrows and arrowheads in e indicate torus semi-circularis and interneuron projections, respectively. f–h MIP images of confocal fluorescence (f), confocal reflectance (g), and AO-SASM (h) for the same zebrafish shown in (a). i MIP image retrieved by AO-SASM for a 6-dpf larval zebrafish. Green arrowheads in (h, i) indicate commissural tracts connecting between medial and lateral projections. The scale bar represents 50 μm. LCa lobus caudalis cerebella, CC crista cerebellaris