
|
FIGURE 2
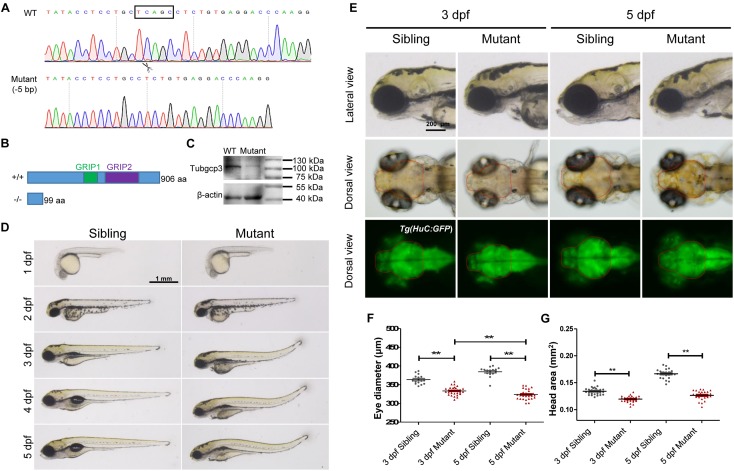
CRISPR/Cas9-mediated tubgcp3 knockout results in zebrafish developmental defects. (A) Sanger sequencing displaying a 5-base pair (bp) deletion in tubgcp3 gene in the zebrafish mutants. The black box indicates the deletion. (B)Predicted structure and amino acid sequence of the wild-type and the mutant alleles of Tubgcp3. The 5-bp deletion in tubgcp3 gene was predicted to generate a 99 amino acid (aa)-truncated Tubgcp3 protein without the GRIP1 domain (green box) and GRIP2 domain (purple box). (C) Western blotting analysis showing Tubgcp3 protein decreased in tubgcp3 mutant embryos at 5 dpf. (D) Whole-mount lateral views of the tubgcp3 mutant and sibling embryos at the indicated developmental stages. (E) Higher magnification of the lateral and dorsal views of zebrafish heads from siblings and tubgcp3mutants at 3 and 5 dpf. The brain size is measured based on the fluorescent area in the head of Tg(HuC:GFP). Red dotted lines indicate the brain area of the embryos used for analysis. (F,G) Scatter plot of eye and head size from wild-type siblings and tubgcp3 mutants at 3 and 5 dpf. Data are from 29 embryos for each group. Student’s t-test: ∗∗P < 0.01. Scale bars: 1 mm (D); 200 μm (E).