
FIGURE 1
- ID
- ZDB-IMAGE-190723-800
- Genes
- Publication
- Li et al., 2019 - Tubgcp3 Is Required for Retinal Progenitor Cell Proliferation During Zebrafish Development
- All Figures
- Figures for Li et al., 2019
|
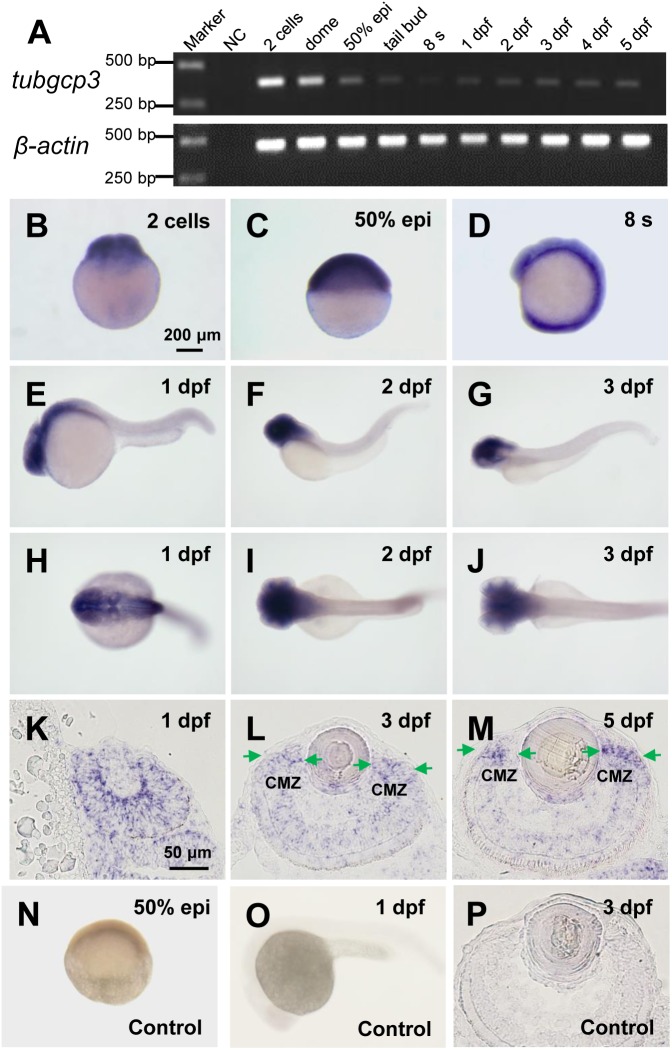
FIGURE 1
Expression of tubgcp3 during zebrafish early development. (A) Semi-quantitative RT-PCR analyses showing the expression of zebrafish tubgcp3 from 2-cell stage to 5 days post-fertilization (dpf). β-actin was used as the internal control. (B–D) Whole-mount in situhybridization (WISH) displaying ubiquitous expression of tubgcp3 at the two-cell stage (B), 50%-epiboly (C) and 8-somite stage (8 s) (D). (E–J) From 1 to 3 dpf, the expression of tubgcp3becomes concentrated at the head. (K–M) In situ hybridization (ISH) of zebrafish retinal cryosections exhibit the expression of tubgcp3 throughout the whole retina at 1 dpf (K). From 3 dpf, its expression is enriched at the ciliary marginal zone (CMZ) (L,M). (N–P) No positive staining is detected with the sense probe. Arrows indicate the CMZ of the retina. Scale bars: 200 μm (B–J,N,O); 50 μm (K–M,P).