
|
Figure 4
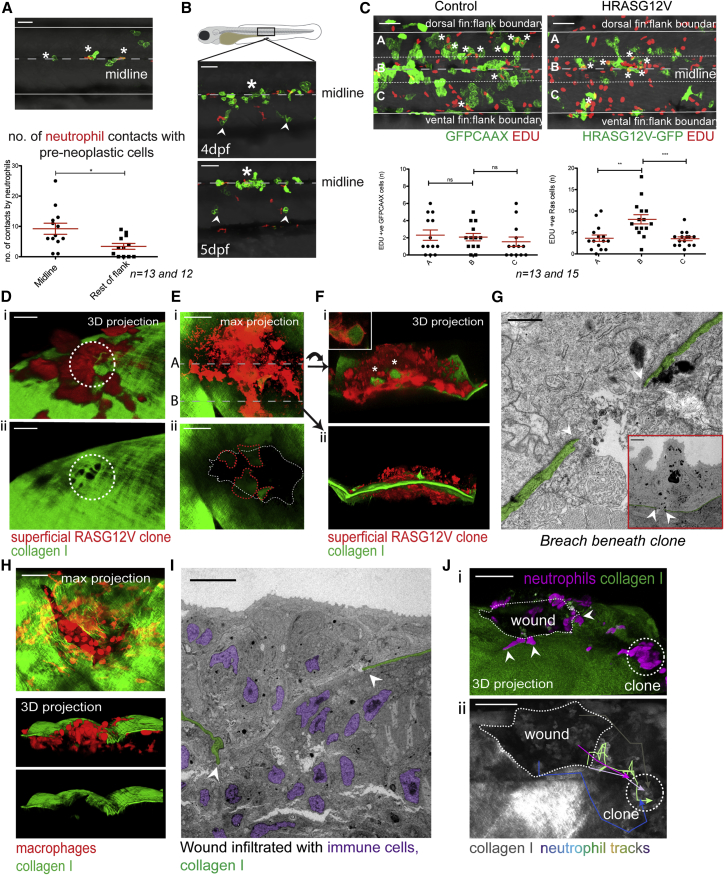
Immune Cells Access Epidermal Clones through Portals in the Basement Membrane
(A) Neutrophil and pre-neoplastic cell contacts (asterisks) along the horizontal myoseptum compared with elsewhere in the flank 8 hpi, over a 3-h period.
(B) Proliferation of clones (asterisk) along the horizontal myoseptum compared with clones farther away (arrowheads).
(C) Example of EDU staining of control, GFPCAAX-expressing basal cells (left) versus GFP-expressing HRASG12V basal cells (right) at 18 hpi. Quantification of double EDU (red) and GFP +ve cells in indicated zones: A, B, and C.
(D–G) Degradation of the BMZ beneath later stage pre-neoplastic cell clones.
(Di) A superficial HRASG12V-expressing clone (red) on collagen I-GFP with holes in the collagen I layer immediately beneath the clone (white dotted circle, Dii) in a larva 6 dpf (96 hpi).
(E) Degraded collagen I-GFP zone beneath a large HRASG12V-expressing superficial clone (red) in a larva 5 dpf (96 hpi; white dotted line in Eii). Lumps of collagen I within the pre-neoplastic cells are outlined (red dotted line).
(Fi) A transverse 3D view of the clone along dotted line A in (Ei). GFP-collagen I within pre-neoplastic cells (asterisks and inset in Fi). See also
(G) TEM shows BMZ degradation (white arrowheads) beneath a large HRASG12V-expressing superficial cell clone (120 hpi) in 6 dpf larvae. See also
(H) Maximal projection confocal image of a flank wound in a larva 7 dpf, 2 days postinjury, shows a defect in the collagen I-GFP layer and recruited macrophages (red). 3D projection shows macrophages (red) below and above the matrix breach.
(I) CLEM shows breach (arrowheads) in the BMZ (green) with invading immune cells (purple nuclei).
(Ji) Neutrophils (magenta) escaping the wound (arrowheads) and crawling over collagen I layer toward pre-neoplastic superficial clone (dotted circle) as indicated by neutrophil tracks in (Jii).
See also