
|
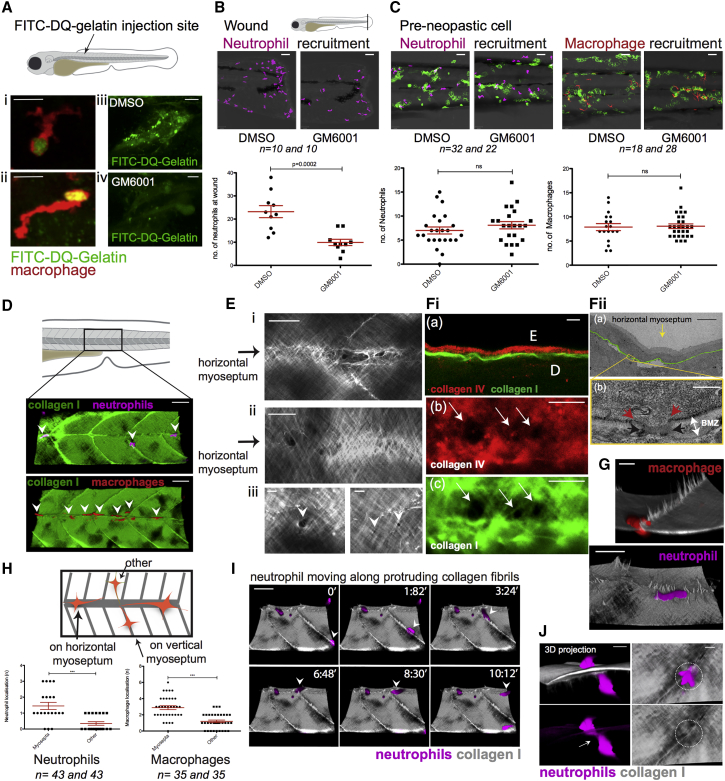
Figure 3
Weak Spots in the BM Barrier Layer Allow Opportunistic Crossing of Immune Cells into the Epidermis
(A) De-quenched fluorescein isothiocyanate (FITC)-gelatin in 3 dpf larva indicates MMP activity (green or yellow) at the leading edge of macrophages (red; i and ii). GM6001 inhibits MMP activity in whole somite (iv versus iii).
(B) GM6001 inhibits neutrophil recruitment to tail fin wound, but does not inhibit neutrophil (magenta) or macrophage (red) recruitment to pre-neoplastic cells in 3 dpf (24 hpi) larvae (C). See also
(D) Neutrophils and macrophages preferentially move along the horizontal myoseptum (indicated with arrowheads) in wild-type 5 dpf larval skin. See also
(E) Collagen along the horizontal myoseptum of 5 dpf larva shows altered structure and gaps or weak spots (i and ii). Higher-magnification view illustrates variation in size of gaps along the horizontal myoseptum (iii, white arrowheads). See also
(Fi) Immunostaining of collagen I (green) and collagen IV (red) at the epidermal (E) dermal (D) interface (a) reveals concomitant holes in collagen IV (b) and collagen I (c) along the horizontal myoseptum of 5 dpf larvae. (ii) TEM of 5 dpf WT larval skin shows a gap through the BMZ at the horizontal myoseptum (yellow arrow in a). Red arrowheads indicate the margins of the BM gap; black arrows define margins of disrupted collagen I in the same location (b).
(G) Macrophages (red, 14 dpf) and neutrophils (magenta, 5 dpf) crawling adjacent to collagen I fiber “tracks” (gray).
(H) Schematic and quantification of neutrophils and macrophages within the flank of 3 dpf larvae.
(I) Still series from a video shows neutrophil (magenta) migrating along the protruding collagen I fibers (gray) at the myosepta (arrowhead) in 5 dpf larva. See also
(J) Neutrophil (magenta) squeezes (arrow) through collagen I at myoseptum in a larva 14 dpf.
Scale bars: 10 μm (Ai, Aii, Fib, and Fic); 20 μm (Aiii, Aiv, Ei, Eii, G, and J); 5 μm (Eiii, Fia, and Fiia); 50 μm (B, C, D, and I); 400 nm (Fiib). Graphs display mean ± SEM.