IMAGE

Fig. 3

ID
ZDB-IMAGE-190723-715
Source
Figures for Deller et al., 2019
Image
Figure Caption

Fig. 3

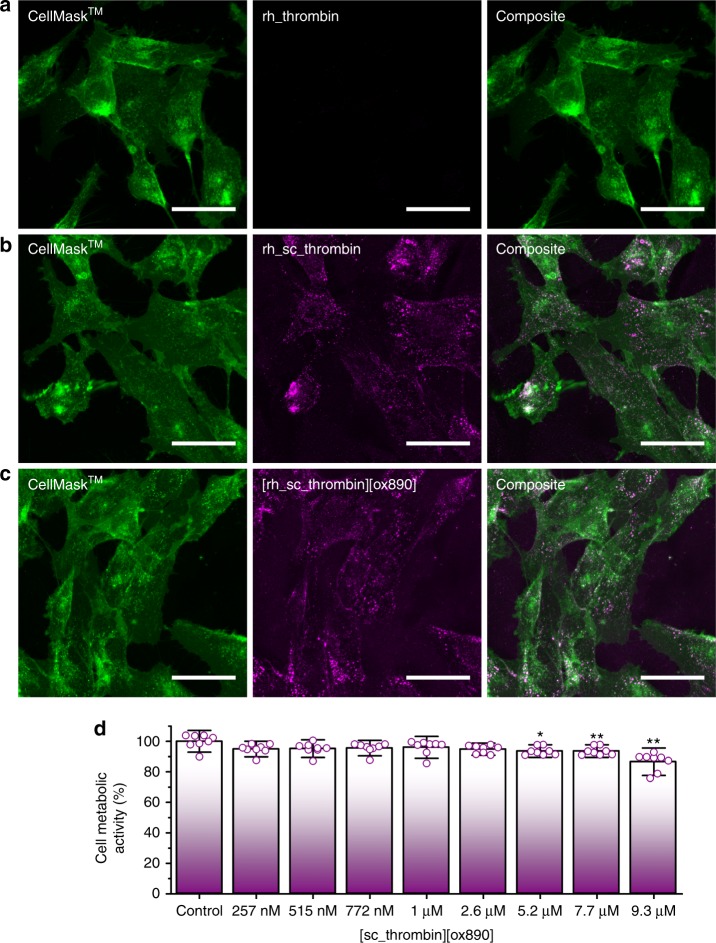
Evaluation of rh_thrombin, rh_sc_thrombin and [rh_sc_thrombin][ox890] hMSC plasma membrane affinity. Cells labelled with CellMask™ Deep Red (green) and corresponding rhodamine labelled thrombin (magenta). a Native (rh_thrombin) thrombin at T = 0 h. b Cationised (sc_rh_thrombin) thrombin at T = 0 h. c Polymer surfactant conjugate ([rh_sc_thrombin][ox890]) thrombin at T = 0 h. Scale bars represent 50 µm. d MTS cell metabolic activity assay (n = 8) of hMSCs after labelling with [sc_thrombin][ox890] compared to unlabelled controls. Data reported as means ± s.d. Dunnett’s test; *p ≤ 0.05, **p ≤ 0.001. Source data are provided as a Source Data file

Acknowledgments
This image is the copyrighted work of the attributed author or publisher, and ZFIN has permission only to display this image to its users. Additional permissions should be obtained from the applicable author or publisher of the image. Full text @ Nat. Commun.