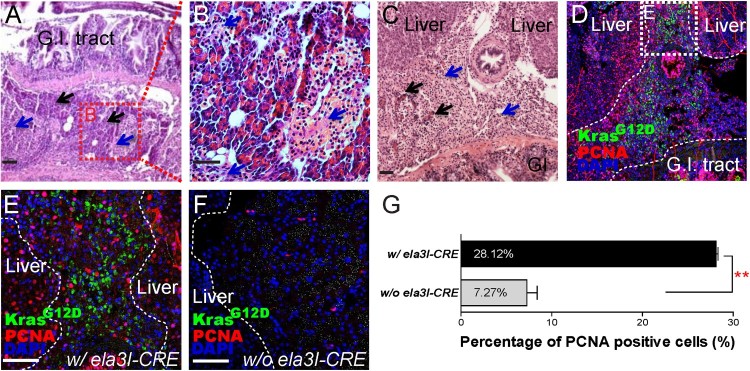
IMAGE

Figure 4.

ID
ZDB-IMAGE-190723-678
Antibodies
Source
Figures for Oh et al., 2019
Image
Figure Caption

Figure 4.

Histological profiles of the abnormal pancreatic region at 6 and 12 months of age. (A–C) Histological examination showed that acinar structure of pancreas (black arrows, zymogen granules in cytoplasm) is disrupted by expansion of populations of poorly differentiated round cells that resemble islet cells (blue arrows). Boxed areas indicate regions depicted at higher magnification in adjacent images. Scale bars: 50 μm. (D and E) GFP and PCNA staining in the abnormal pancreatic region. GFP and PCNA staining was observed in the poorly differentiated cells. Boxed areas indicate regions depicted at higher magnification in adjacent images. Scale bars: 50 μm. (F) In the control group (w/o ela3I-CRE), no GFP and infrequent PCNA staining was observed in the pancreas. Scale bars: 50 μm. (G) Comparison of PCNA positive cells. Highly frequent PCNA staining was observed in the poorly differentiated cells (w/ ela3I-CRE) (28.12%) compared to that in the control group (w/o ela3I-CRE) (7.27%) (**P < .01, Student’s t-test). Means ± S.D., N = 3. Gastrointestinal tract (G.I. tract).

Figure Data
Acknowledgments
This image is the copyrighted work of the attributed author or publisher, and ZFIN has permission only to display this image to its users. Additional permissions should be obtained from the applicable author or publisher of the image. Full text @ Animal Cells Syst (Seoul)