IMAGE

Figure 2

ID
ZDB-IMAGE-190723-474
Source
Figures for Page et al., 2019
Image
Figure Caption

Figure 2

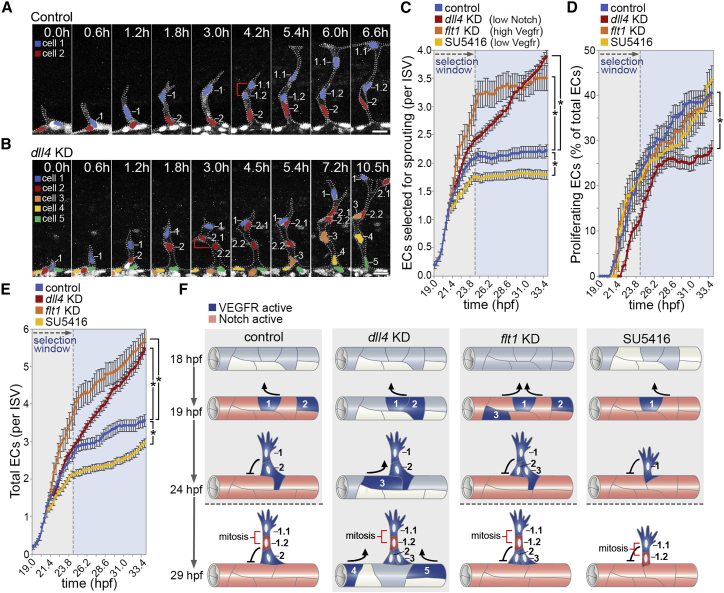
Switch-like Behavior of Motile EC Selection in Angiogenesis In Vivo

(A and B) Time-lapse images of EC nuclei in ISVs of control (A) and dll4 KD (B) Tg(kdrl:nlsEGFP)zf109 embryos from 19 h post-fertilization (hpf). Brackets indicate dividing cells. Nuclei are pseudocolored.

(C–E) Quantification of the number of ECs that are selected to branch (C), undergo proliferation (D), or the total number of ECs per ISV (E) in control, dll4 KD, flt1 KD, and 0.3 μM SU5416-treated embryos (n = 47 ISVs from 16 control, 78 ISVs from 24 dll4 KD, 28 ISVs from 8 flt1 KD, and 81 ISVs from 23 0.3 μM SU5416-treated embryos).

(F) Illustration of the biphasic nature of the selection of motile ECs in angiogenesis. Vegf signal levels define the number of ECs selected to branch, and Dll4-mediated LI prevents further selection of motile ECs. Increased Vegf (flt1 KD) or decreased Vegf (0.3 μM SU5416) signaling results in the selection of more or less motile ECs, respectively. In the absence of dll4, motile ECs continue to be selected.

Data are mean ± SEM. p < 0.05, two-way ANOVA test. Scale bars, 25 μm.

See also Figure S1.

Acknowledgments
This image is the copyrighted work of the attributed author or publisher, and ZFIN has permission only to display this image to its users. Additional permissions should be obtained from the applicable author or publisher of the image. Full text @ Cell Rep.