IMAGE

Figure 1

ID
ZDB-IMAGE-190723-375
Source
Figures for Kulkarni et al., 2018
Image
Figure Caption

Figure 1

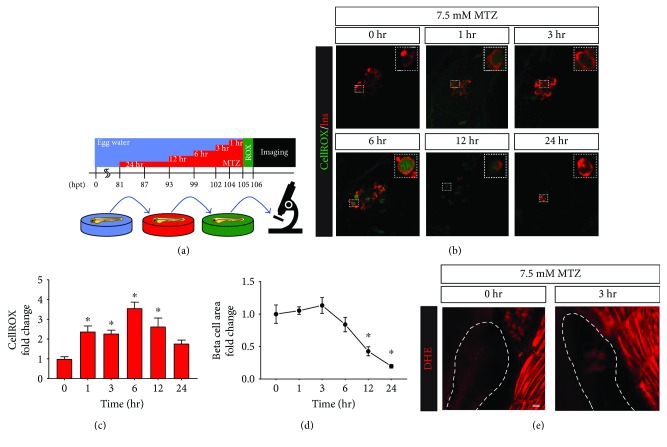
Time-dependent metronidazole induction of β-cell-specific ROS. (a) Schematic of MTZ treatments and imaging. Zebrafish (NTR+) larvae were treated with MTZ or vehicle for 0, 1, 3, 6, 12, or 24 hours with a “staggered start” such that all treatments were completed simultaneously; larvae were then incubated with CellROX green stain at 105 hpf and fixed/analyzed at 106 hpf. (b) Representative immunofluorescence images of zebrafish pancreatic islets stained with insulin antibody and CellROX green after 7.5 mM MTZ treatments. Magnified insets (bounded by dashed boxes) highlight the dose-dependent increase in CellROX green signal in β-cells. (c) Quantification of CellROX green intensity in insulin-positive β-cells showing a significant increase in ROS generation after 1, 3, 6, and 12 hours of MTZ treatment as compared to vehicle-treated controls (n = 12 for each condition). (d) MTZ treatment caused a significant decrease in β-cell area after 12 or 24 hours of treatment as compared to untreated controls. (e) Representative immunofluorescence images of zebrafish pancreatic islets treated for 3 hours with 0 or 7.5 mM MTZ and stained with 5 μM DHE. Dotted lines demarcate the boundaries of the pancreas. Graphed data are presented as mean ± SEM (p < 0.05). Statistical significance was determined by one-way ANOVA followed by post hoc Holm-Sidak test. Scale bar indicates 10 μm.

Acknowledgments
This image is the copyrighted work of the attributed author or publisher, and ZFIN has permission only to display this image to its users. Additional permissions should be obtained from the applicable author or publisher of the image. Full text @ Oxid Med Cell Longev