IMAGE

Figure 8

ID
ZDB-IMAGE-190723-355
Source
Figures for Sharma et al., 2019
Image
Figure Caption

Figure 8

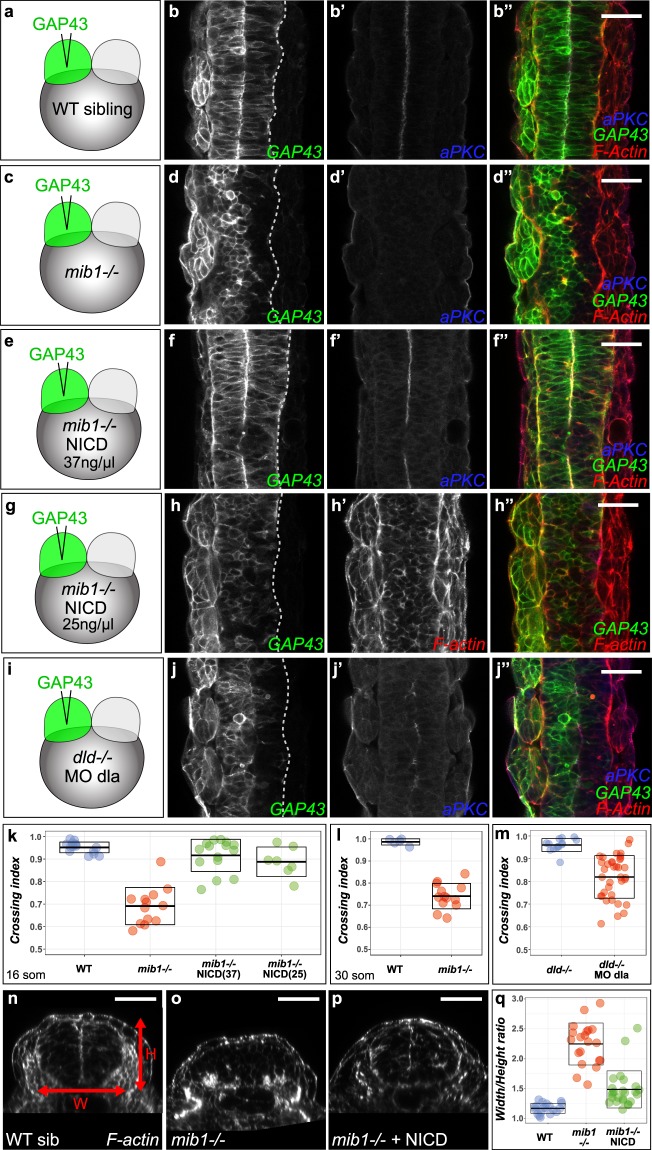
Notch loss of function impairs morphogenetic cell movements in the zebrafish spinal cord. (a–i) To label one half of the neural tube RNA encoding a fluorescent membrane label (GAP43-GFP) was injected into one blastomere of two cell stage embryos (see Methods). (a,b) In 16 somites stage WT siblings, cells from one half of the neural tube cross the organ midline to integrate the contra-lateral half. (c,d) In mib1 mutants, neural tube cells fail to display this behavior. (e,f) RNA injection of constitutively activated Notch (NICD) at a concentration of 37.5 ng/µl restores apico-basal polarity (apical aPKC enrichment at the neural tube midline in f’ compared to d’) and midline-crossing cell movements (f) in mib1 mutants. (g,h) Injection of a lower dose of NICD (25 ng/µl) fails to restore neuroepithellial morphology (note the lack of apical F-actin accumulation at the neural tube midline in h’) but is sufficient to promote midline crossing (h). (i,j) Neural tube cells display reduced midline crossing in dld; dla compound mutant/morphants. (k) Quantification of neural tube midline crossing in WT, mib1 mutants and NICD-injected mib1 mutants (for details and statistical analysis see Methods, Supplementary Fig. S6i and Supplementary Table S2). (l) Reduced midline crossing is also observed if WT sibling (crossing index 0.98 ± 0.01, n = 5) and mib1 mutants (0.74 ± 0.06, n = 13) are compared at the 30 somites stage (p = 3.9E-10, see also Supplementary Fig. S6g,h). (m) Midline crossing is reduced in dld; dla mutants/morphants (0.82 ± 0.09, n = 36) compared to dld single mutants (0.96 ± 0.03, n = 14) (p = 2.1E-10). (nq) Transversal sections of the anterior spinal cord used to measure neural tube width (W) and Height (H). mib1 mutants (o) present an increased W/H ratio compared to WT siblings (n). NICD RNA injection restores neural tube proportions (p). (q) Quantification of W/H ratios, see Supplementary Table S4 for statistical analysis. (b,d,f,h,j) dorsal views of the anterior spinal cord at the 16 somites stage, anterior up. (np) transversal sections of the anterior spinal cord at 30 somites, after the completion of midline crossing. Scalebars: 40 µm. Boxes in (k,l,m,q) represent mean values ± SD.

Acknowledgments
This image is the copyrighted work of the attributed author or publisher, and ZFIN has permission only to display this image to its users. Additional permissions should be obtained from the applicable author or publisher of the image. Full text @ Sci. Rep.