
|
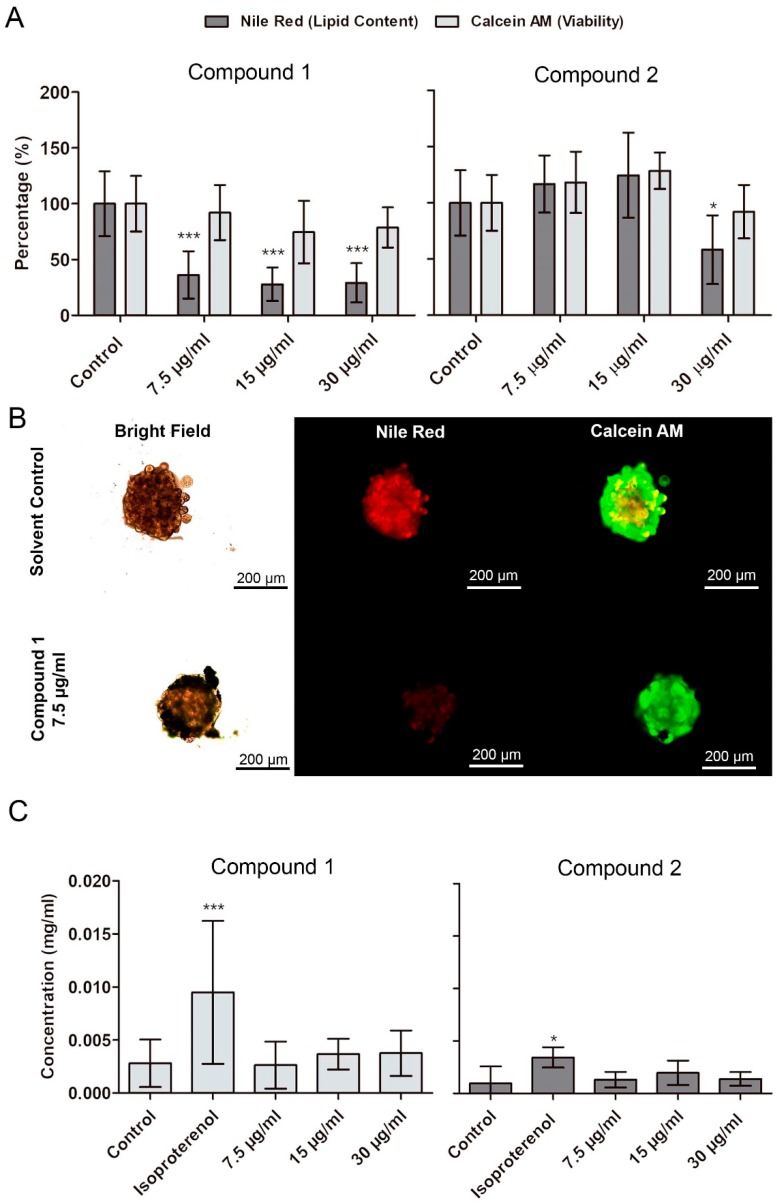
Figure 4
Quantification of lipid content (Nile red) and viability (calcein AM) in differentiated 3T3-L1 spheroids after exposure to 1 and 2 over 48 h. (A) Results of quantification of fluorescence by CellProfiler software (mean ± SD). (B) Representative images from fluorescence microscopy. Statistical differences to the solvent control were analyzed by one-way ANOVA, followed by a Dunnett’s multiple comparison post-test (*** p <0.001, ** p < 0.01, * p < 0.05). (C) Quantification of free glycerol on the medium where 3T3-L1 organoids were exposed to 1 and 2 over 48 h. Data represent means ± SD. No significant alterations on free glycerol content in the medium were observed. Kolmogorov–Smirnov test was used to test normality of the data, followed by a Dunnett’s multiple comparison post-test (*** p <0.001, ** p < 0.01, * p < 0.05).