
|
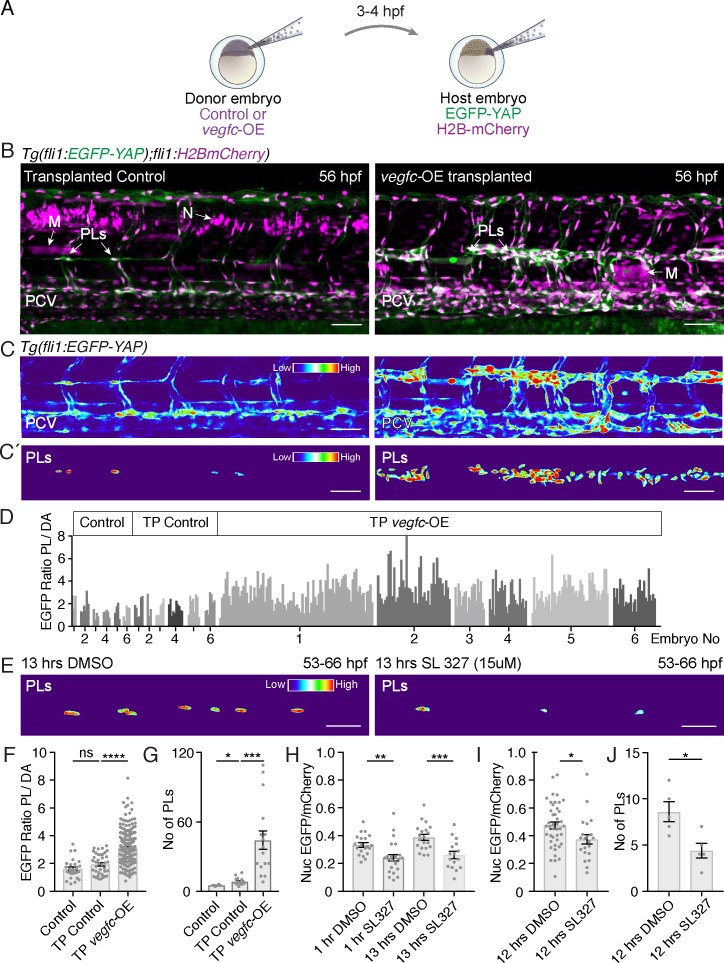
Fig. 5
Yap1 mediates endothelial cell proliferation downstream of Vegf
Vegfc promotes nuclear Yap1 in developing lymphatic progenitors.
( A) Schematic showing the transplantation of vegfc-OE cells into EGFP-YAP reporter hosts. ( B) Trunk vasculature of YAP reporter host embryos with neuron and muscle grafts expressing RFP (magenta) at 56 hpf. Control grafts (left) and vegfc-OE grafts (right). Posterior cardinal vein (PCV); Muscle ( M); parachordal LECs (PLs); Neuron ( N). Scale bars: 50 μm in B and C. ( C) Heatmaps of maximum projections of EGFP-YAP from B) showing PLs and PCV. Red corresponds to high EGFP-YAP fluorescence. ( C’) Lower panels show heatmaps of EGFP-YAP in PL nuclei. ( D) EGFP intensity for each PL expressed as a ratio to the average of 6 dorsal aorta (DA) cells (unresponsive to vegfc). six embryos per group: untransplanted host (control) (PL n = 27), transplanted control without the UAS:vegfc construct (TP Control) (PL n = 40) and vegfc-OE transplanted embryos (TP vegfc-OE) (PL n = 251). Individual embryos indicated by an individual grey shade. ( E) Heatmaps of EGFP-YAP depicting PL nuclei of embryos at 66 hpf that were treated with DMSO (left) and SL327 for 13 hr (hrs) (right). Max projections are from time-lapse Videos. Scale bars: 30 μM. ( F) EGFP mean intensity for each PL/DA in panel D (Control: 1.61 ± 0.13, n = 27; TP Control: 1.93 ± 0.12, n = 40; p=0.08 (ns); TP vegfc-OE: 3.14 ± 0.07, n = 251; p<0.0001(****)). ( G) Quantification of PL number across six somites for each group (Control: 5 ± 0.26, n = 6; TP Control: 8 ± 0.78, n = 16; p=0.0157 (*); TP vegfc-OE: 44 ± 8.04, n = 16; p=0.0001(***)). ( H) Quantifications of the mean EGFP/mCherry fluorescent intensity ratio in PL nuclei from time-lapse Video stills. Embryos were mounted in DMSO as control (n = 5) or SL327 (15 μM) (n = 5) and continuously imaged for 12 hr starting at 54 hpf (1 hr drug treatment), finishing at 66 hpf (13 hr) (1 hr DMSO: 0.33 ± 0.02, n = 20; 1 hr SL327: 0.24 ± 0.02, n = 23; p=0.0036 (**)) (13 hr DMSO: 0.39 ± 0.02, n = 20; 13 hr SL327: 0.26 ± 0.03, n = 16; p=0.0006(***)). ( I) Quantifications of mean EGFP/mCherry Ratio in PLs of embryos at 66 hpf treated with DMSO/SL327 for 12 hr from 54 hpf to 66 hpf without time-lapse imaging (12 hr DMSO: 0.47 ± 0.02, PLs n = 43; 13 hr SL327: 0.37 ± 0.03, PLs n = 22; p=0.02 (*)). ( J) Quantification of PL number in embryos treated with DMSO/SL327 for 12 hr at 66 hpf without time-lapse imaging (12 hr DMSO: 8.6 ± 1.08, embryo n = 5; 13 hr SL327: 4.4 ± 0.81, embryo n = 5; p=0.014 (*)).