IMAGE

Figure 1

ID
ZDB-IMAGE-190723-2277
Source
Figures for de Jong et al., 2012
Image
Figure Caption

Figure 1

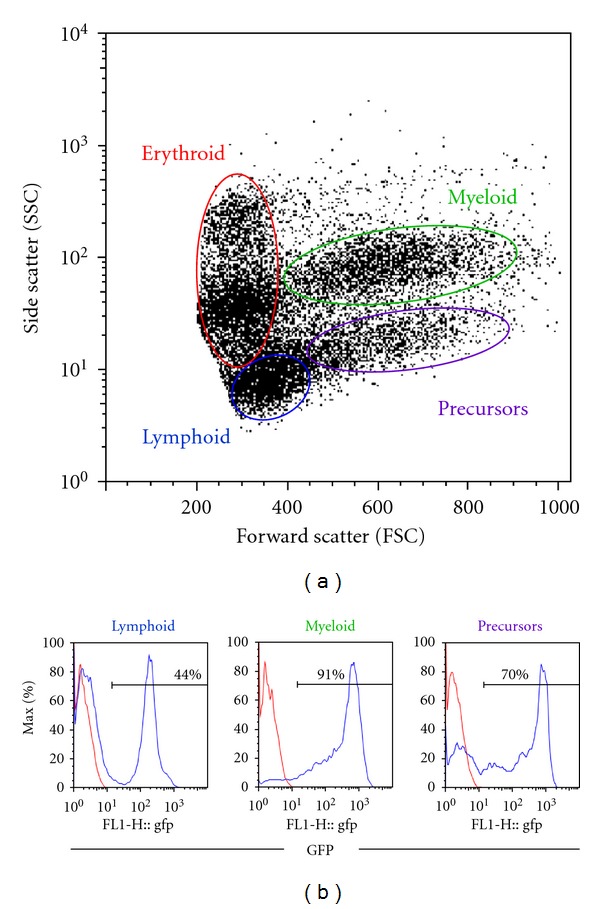
Flow cytometry analysis of zebrafish whole kidney marrow from a marrow transplant recipient. Zebrafish transplant recipients were irradiated and injected with 5 × 10⁵ marrow cells from a transgenic β-actin:GFP donor. Whole kidney marrow from a representative recipient was dissected 3 months later and analyzed by flow cytometry. (a) The forward scatter (FSC) versus side scatter (SSC) profile of zebrafish whole kidney marrow shows four cell populations: erythroid, lymphoid, myeloid, and precursor cells. (b) Histograms for GFP expression of cells within the lymphoid, myeloid and precursor gates show multilineage engraftment with GFP+ donor cells (blue lines). The red lines show GFP expression in a wild-type-negative control fish.

Acknowledgments
This image is the copyrighted work of the attributed author or publisher, and ZFIN has permission only to display this image to its users. Additional permissions should be obtained from the applicable author or publisher of the image. Full text @ Adv. Hematol.