
Image
|
Figure Caption
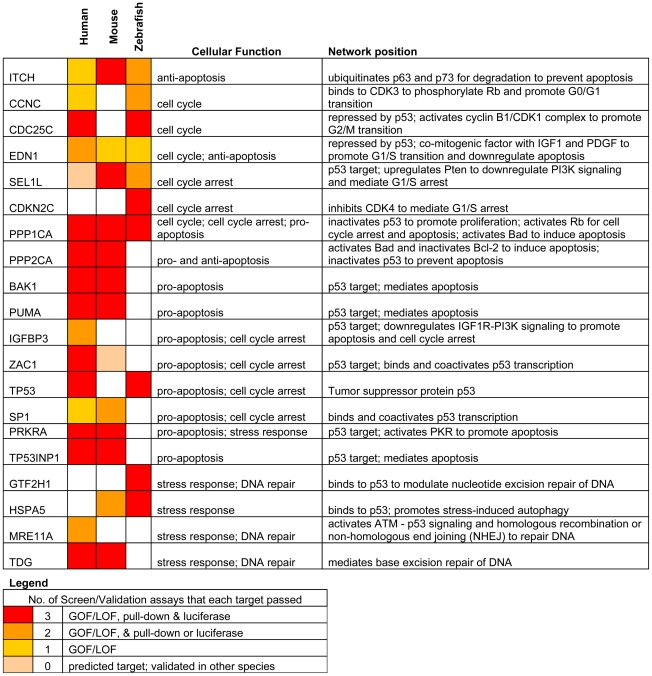
Figure 5
Only targets that passed ≥ 2 validation assays, in at least one species, are shown. Red: predicted targets validated by 3 assays; Orange: predicted targets validated by 2 assays; Yellow: predicted targets validated by 1 assay; Pink: predicted targets not validated by any assay, but validated by 3 assays in another species.
Acknowledgments
This image is the copyrighted work of the attributed author or publisher, and
ZFIN has permission only to display this image to its users.
Additional permissions should be obtained from the applicable author or publisher of the image.
Full text @ PLoS Genet.