
|
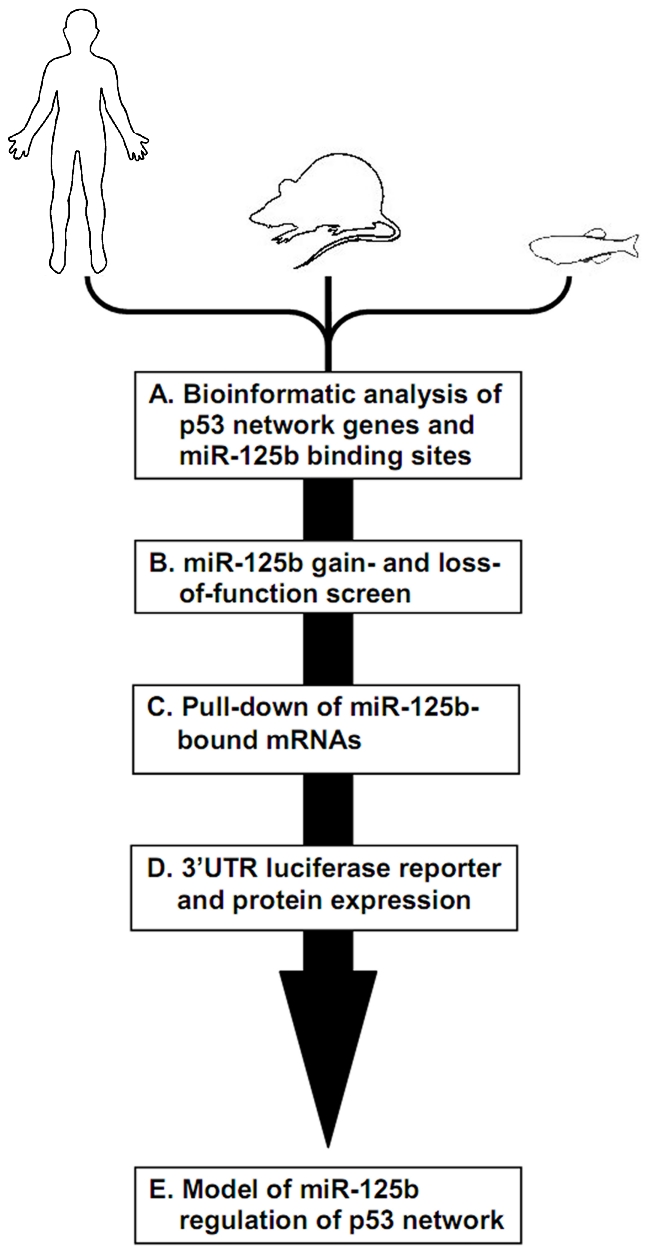
Figure 1
Schematic of experimental design and workflow. (A) Bioinformatic analysis was performed on p53 network genes listed in the Ingenuity Pathways Analysis database and p53 Knowledgebase, and miR-125b binding sites predicted by the TargetScan and MicroCosm databases. (B) p53 network genes were screened for miR-125b targets by using gain- (GOF) and loss-of-function (LOF) of miR-125b in human cells, mouse cells and zebrafish embryos, as indicated by effects on gene expression using qRT-PCR. (C) p53 network genes that were positive in either the GOF or LOF screen were assayed for direct binding to miR-125b using a biotinylated microRNA pull-down method. (D) p53 network genes that were also positive in the miR-125b pull-down were finally validated as miR-125b targets by 3′ UTR luciferase reporter assays and Western blots for protein expression. (E) A model of how miR-125b regulates the p53 network across vertebrates was constructed using our combined datasets for human, mouse and zebrafish cells.