IMAGE

Figure 1

ID
ZDB-IMAGE-190723-1756
Source
Figures for Darras et al., 2011
Image
Figure Caption

Figure 1

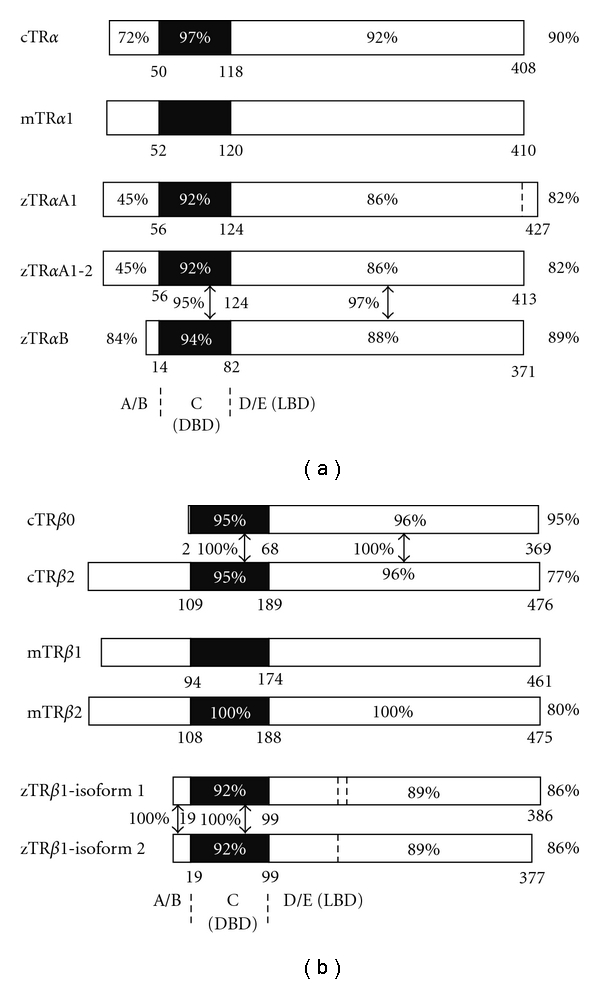
Comparison of mouse (m), chicken (c), and zebrafish (z) TR isoforms. (a) TRα variants and (b) TRβ variants. Truncated TR isoforms that do not bind T3 are not included, nor are the TRβ3 variants that have only been found in rats. Numbering of amino acids is represented under each bar. Percentages within the bars are identities of that domain with the homologous domain of mTRα1 or mTRβ1, respectively. Percentages right of the bars give the overall similarity of the entire protein with the canonical mouse homolog. Percentages in between bars show the similarity between the respective domains. A/B: A and B domain; C (DBD): C domain or DNA-binding domain; D/E (LBD): D and E domain or ligand-binding domain. The dotted line in the D/E domain of zTRαA1 marks the first of the 14 additional carboxy-terminal amino acids not found in the other TRs. The dotted lines in the D/E domain of zTRβ1 isoform 1 delineate a 9-amino-acid insert that is missing in the equivalent location in zTRβ1 isoform 2 (also indicated with a dotted line). Comparisons were based on the following UniProtKB sequences: mTRα1 (P63058-2), mTRβ1 (P37242-1), mTRβ2 (P37242-2), cTRα1 (P04625), cTRβ0 (P68306), cTRβ2 (Q91003), zTRαA1 (Q98867-1), zTRα1-2 (Q98867-2), zTRαB (A0ST48), zTRβ1-isoform 1 (Q9PVE4-1), and zTRβ1-isoform 2 (Q9PVE4-2).

Acknowledgments
This image is the copyrighted work of the attributed author or publisher, and ZFIN has permission only to display this image to its users. Additional permissions should be obtained from the applicable author or publisher of the image. Full text @ J. Thyroid Res.