
|
Fig. 1
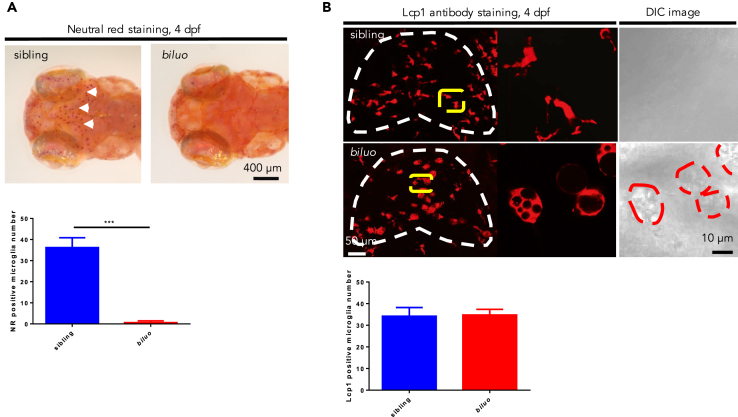
Aberrant Morphology of Embryonic Microglia in biluo Mutants
(A) Neutral red staining of 4-dpf siblings and mutants. Abundant microglia (white arrows) are positive for neutral red in the siblings (left) but not in the mutants. Quantification data of neutral red positive microglia number in 4-dpf siblings and mutants. n(sibling) = 7 embryos, n(biluo) = 6 embryos. ***p < 0.001 Error bars represent mean ± SD.
(B) Lymphocyte cytosolic lplastin1 (Lcp1) antibody staining and DIC images of the brains of 4 dpf embryos indicate that microglia are present in biluo mutants but exhibit an abnormal enlarged morphology with accumulation of vacuoles. Quantification data of Lcp1 positive microglia number in 4 dpf siblings and mutants. White dashed lines indicate the optic tectum, yellow lines indicate the microglia presented in high magnification view on the right, and red dashed lines indicate the mutant microglia under DIC view. n(sibling)= 4 embryos, n(biluo)=6 embryos. Error bars represent mean ± SD.
Aberrant Morphology of Embryonic Microglia in biluoMutants
(A) Neutral red staining of 4-dpf siblings and mutants. Abundant microglia (white arrows) are positive for neutral red in the siblings (left) but not in the mutants. Quantification data of neutral red positive microglia number in 4-dpf siblings and mutants. n(sibling) = 7 embryos, n(biluo) = 6 embryos. ***p < 0.001 Error bars represent mean ± SD.
(B) Lymphocyte cytosolic lplastin1 (Lcp1) antibody staining and DIC images of the brains of 4 dpf embryos indicate that microglia are present in biluo mutants but exhibit an abnormal enlarged morphology with accumulation of vacuoles. Quantification data of Lcp1 positive microglia number in 4 dpf siblings and mutants. White dashed lines indicate the optic tectum, yellow lines indicate the microglia presented in high magnification view on the right, and red dashed lines indicate the mutant microglia under DIC view. n(sibling)= 4 embryos, n(biluo)=6 embryos. Error bars represent mean ± SD.