
|
Fig. 3
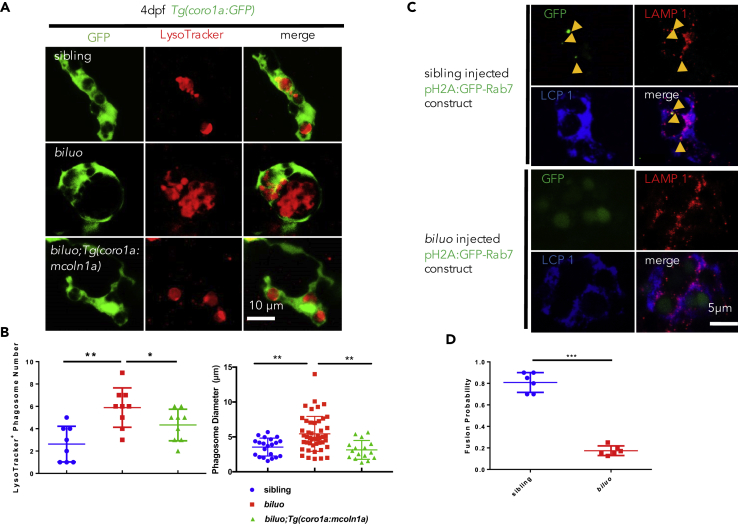
The Late Endosome and Lysosome Fusion Is Impaired in the biluo Microglia
(A) Fluorescent imaging (green) and LysoTracker staining of 4-dpf sibling, biluo, and Tg(coro1a:mcoln1a);biluo embryos show that the accumulation of acid phagosomes in biluo mutant microglia (middle panel) and morphological defect of microglia in biluo mutants can be rescued by ectopically expressing WT mcoln1a in microglia (lower panel).
(B) Quantification of the number and diameter of LysoTracker-positive phagosomes in the microglia in 4-dpf Tg(coro1a:GFP) siblings (blue dots), Tg(coro1a:GFP);biluo mutants (red squares), and Tg(coro1a:mcoln1a);biluo embryos (green triangles). n(sibling) = 8 microglia from 5 embryos; n(biluo) = 9 microglia from 5 embryos; n(Tg(coro1a:mcoln1a);biluo) = 9 microglia from 5 embryos. **p < 0.01, *p < 0.05, ANOVA. Error bars represent mean ± SD.
(C) Anti-GFP (green), anti-LAMP1, and anti-Lcp1 (blue) triple antibody staining of WT embryos injected H2A:GFP-Rab7. Upper panels represent WT microglia (blue); late endosomes (green) are co-localized with the lysosomes. Lower panels represent mutant microglia (blue); late endosomes (green) are not co-localized with lysosomes.
(D) Quantification of fusion probability of late endosomes and lysosomes in sibling microglia (blue dots) and mutant microglia (red squares). n(sibling) = 6 microglia from 4 embryos, n(biluo) = 6 microglia from 4 embryos. ***p < 0.001. Error bars represent mean ± SD.