IMAGE

Figure 4

ID
ZDB-IMAGE-190723-1548
Source
Figures for Balciuniene et al., 2013
Image
Figure Caption

Figure 4

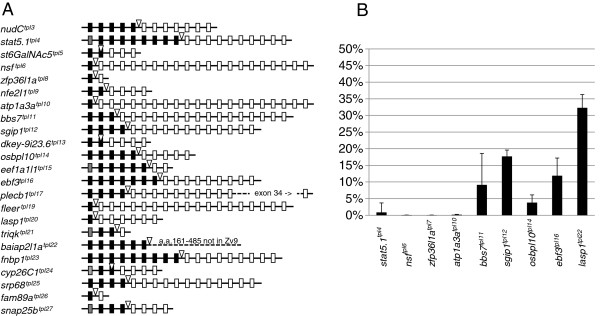
Characterization of GBT-B1 gene trap events at the molecular level. (A) Schematic illustration of molecularly characterized gene trap events. Gene trap integration is indicated by an open triangle. Exons upstream of gene trap integration are shown as black (coding exons) or grey (non-coding exons) boxes. Exons downstream of gene trap integration are shown as open boxes. Integrations into jam3b and fam46bb are not shown because they do not form in-frame fusions with the upstream exon. (B) Levels of wild-type transcript present in homozygous gene trap mutants.

Acknowledgments
This image is the copyrighted work of the attributed author or publisher, and ZFIN has permission only to display this image to its users. Additional permissions should be obtained from the applicable author or publisher of the image. Full text @ BMC Genomics