
|
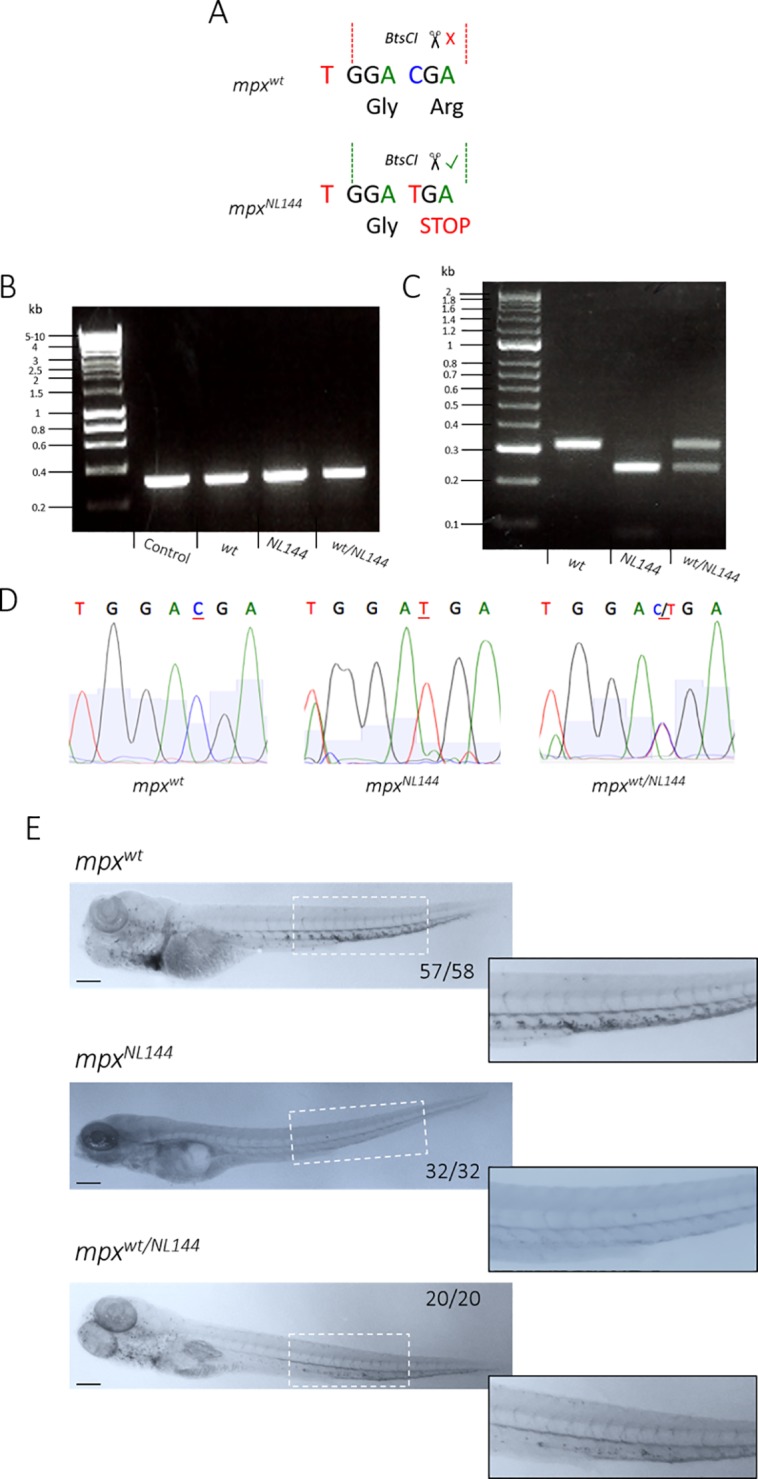
Fig 7
A) Diagram of a WT (mpxwt) and mutated (mpxNL144) gene, showing the BtsCI restriction site cutting only the mutated mpxNL144 gene. B) PCR amplification of the mpxgene from the genomic DNA of mpxwt, mpxwt/NL144 and mpxNL144 fish–fragment 312bp; control DNA is a positive control from a separate genotyping experiment. Hyperladder 1kb. C) Diagnostic digest of the PCR product from mpxwt, mpxwt/NL144 and mpxNL144fish. Band sizes: mpxwt- 312bp, mpxNL144- 230bp, mpxwt/NL144- 312bp and 230bp. Hyperladder 100bp plus. D) DNA sequencing of the PCR products to confirm the accuracy of the BtsCI digest. E) mpxwt, mpxNL144 and mpxwt/NL144 larvae fixed at 4dpf and stained with Sudan Black B. Larvae with at least one functional mpx allele stained (57/58 mpxwt, 20/20 mpxwt/NL144) and larvae that do not produce Mpx did not stain (32/32 mpxNL144). Inset shows an enlarged view of the region indicated by the dashed white box. Scale bar = 200μm.