IMAGE

Figure 2

ID
ZDB-IMAGE-190723-139
Source
Image
Figure Caption

Figure 2

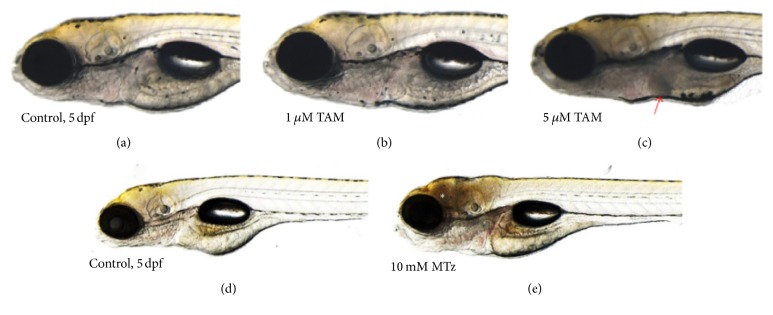
Tissue-specific cell death in the zebrafish larvae treated with tamoxifen (TAM) or metronidazole (Mtz). (a) 0.1% DMSO-treated control (5 dpf) and (b) 1 μM and (c) 5 μM TAM-treated zebrafish larvae. (d) 0.1% DMSO-treated control (5 dpf) and (e) 10 mM Mtz-treated zebrafish larvae. Liver-specific cell death was visualized by reduction of transparency in the TAM-treated zebrafish larvae (red arrow), compared to brain-specific cell death in the Mtz-treated larvae (white asterisk). For Mtz experiments, the transgenic zebrafish system, having neuron-specific nitroreductase expression, was used [20].

Acknowledgments
This image is the copyrighted work of the attributed author or publisher, and ZFIN has permission only to display this image to its users. Additional permissions should be obtained from the applicable author or publisher of the image. Full text @ Biomed Res. Int.