IMAGE

Fig 5

ID
ZDB-IMAGE-190723-1341
Genes
Source
Figures for Krall et al., 2019
Image
Figure Caption

Fig 5 Quantitative reverse transcriptase-polymerase chain reaction to assess <italic>bmp4</italic> expression.

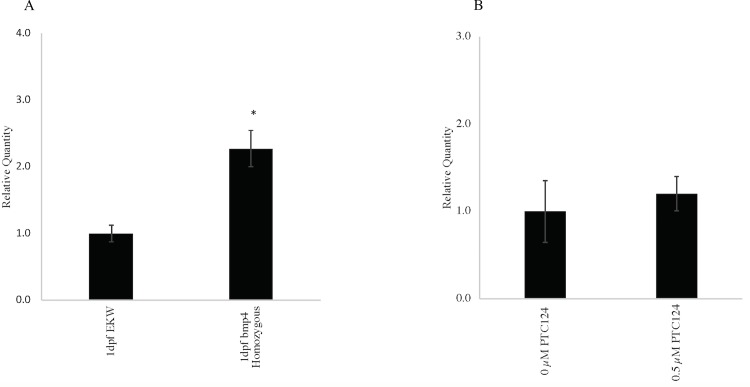
Fig 5A. Quantitative reverse transcriptase-polymerase chain reaction (qRT-PCR) showing bmp4 expression in untreated wildtype and bmp4st72/st72 homozygous larvae at 1 day post fertilization (dpf). RNA was extracted at 1 dpf from untreated, pooled wildtype EKW larvae and bmp4st72/st72 homozygous larvae. After cDNA synthesis, qRT-PCR was performed and analyzed using the ΔΔCt method and eef1a1l1 as an internal control gene. The results, plotted as relative quantity (RQ) normalized to bmp4 expression in wildtype EKW larvae at 1.0 show increased bmp4 expression in bmp4st72/st72 homozygous larvae (p = 0.014), consistent with bmp4 RNA available for rescue using nonsense suppression therapy. All values are an average of 3 replicates and 3 biological replicates were performed for each experiment. The error bars indicate the standard error (SE) of the mean. Fig 5B. Quantitative reverse transcriptase-polymerase chain reaction (qRT-PCR) showing bmp4 expression in incrossed bmp4st72/+ heterozygous larvae treated with 0 μM PTC124 and incrossed bmp4st72/+ heterozygous larvae treated with 0.5 μM PTC124 from 6–8 hours post fertilization (hpf). RNA was extracted at 3 days post fertilization (dpf) from pooled larvae treated with 0 μM PTC124 and larvae that had been treated with 0.5 μM PTC124 from 6–8 hpf. After cDNA synthesis, qRT-PCR was performed and analyzed using the ΔΔCt method and eef1a1l1 as an internal control gene. The results, plotted as relative quantity (RQ) normalized to bmp4 expression (1.0) in incrossed, bmp4st72/+ heterozygous larvae that were treated with 0 μM PTC124 show a non-significant increase in bmp4 expression in incrossed, bmp4st72/+ heterozygous larvae treated with 0.5 μM PTC124 (p = 0.09). All values are an average of 3 replicates and 3 biological replicates were performed for each experiment. The error bars indicate the standard error (SE) of the mean.

Figure Data
Acknowledgments
This image is the copyrighted work of the attributed author or publisher, and ZFIN has permission only to display this image to its users. Additional permissions should be obtained from the applicable author or publisher of the image. Full text @ PLoS One