IMAGE

Figure 1

ID
ZDB-IMAGE-190723-1231
Source
Figures for Charlton-Perkins et al., 2019
Image
Figure Caption

Figure 1

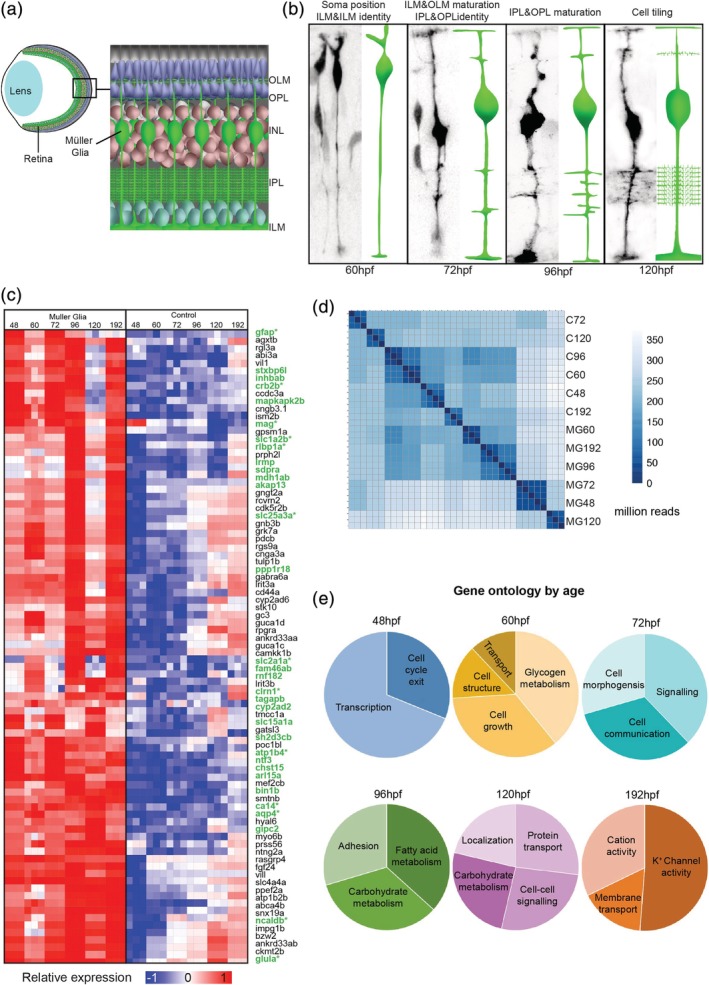
Temporal MG cell morphology and gene expression.(a) Diagrammatic representation of the retina within the eye showing the positioning of MG cells. (b) Tg(TP1:Venus) transplanted MG cells showing the time course of MG cell differentiation that gives rise to the distinct MG compartments (OLM: outer limiting membrane; OPL: outer plexiform layer; INL: inner nuclear layer; IPL: inner plexiform layer, ILM: inner limiting membrane). (c) Heatmap (relative expression values by sample—CPM) of top 100 significantly expressed genes in MG (GFAP‐GFP cells) compared to control (GFP negative cells) retinal cells (known glial genes are green and * indicates previous reported expression in MG) (see Supporting Information Table S1 for normalized enrichments). (d) Hierarchical clustering of samples used for RNA‐seq demonstrating consistency between the three replicates used for each time point (MG—GFAP‐GFP sorted cells, C—GFP negative control tissue) (e) Representative gene ontology proportions of MG genes enriched at 48, 60, 72, 96,120, and 196hpf

Acknowledgments
This image is the copyrighted work of the attributed author or publisher, and ZFIN has permission only to display this image to its users. Additional permissions should be obtained from the applicable author or publisher of the image. Full text @ Glia