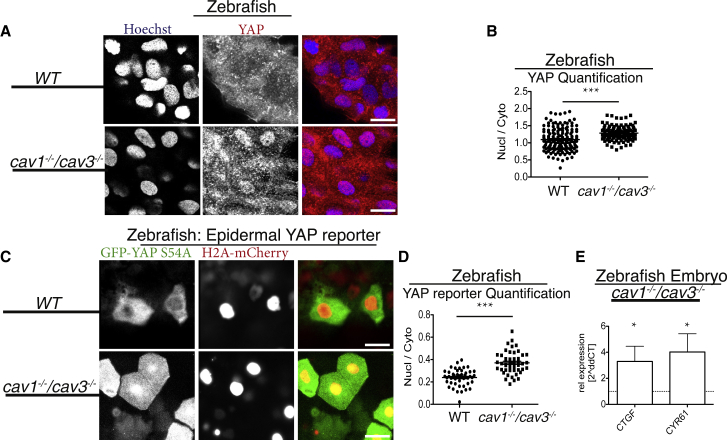
IMAGE

Figure 6

ID
ZDB-IMAGE-190723-1200
Source
Figures for Rausch et al., 2018
Image
Figure Caption

Figure 6

CAVEOLINs Are Negative Regulators of YAP/TAZ In Vivo

(A) Images of epithelial cells from WT and cav1−/−/cav3−/ 48 hpf zebrafish embryos labeled for Hoechst (blue) and YAP (red). Note the increased nuclear YAP localization in cav1−/−/cav3−/ cells. Scale bars represent 25 μm.

(B) Quantification of cellular nuclear-to-cytoplasmic ratio from cav1−/−/cav3−/ superficial epidermal cells compared to WT. Each dot represents one cell. n > 100. Means ± SEM.

(C) Images from cav1−/−/cav3−/ and WT zebrafish embryos expressing epidermal EGFP-yap S54A (Tead-binding-deficient zebrafish yap mutant) and H2A-mCherry (nuclear marker). Note the predominantly nuclear YAP localization in the cav1−/−/cav3−/ epidermal cells compared to WT. Scale bars represent 20 μm.

(D) Quantification of nuclear-to-cytoplasmic ratio from cav1−/−/cav3−/ epidermal cells compared to WT. Each dot represents one cell. n > 50 from each genotype. Means ± SEM (related to Figure S5H).

(E) qPCR analysis from four-day-old cav1−/−/cav3−/ and WT zebrafish embryos. Means ± SD.

Acknowledgments
This image is the copyrighted work of the attributed author or publisher, and ZFIN has permission only to display this image to its users. Additional permissions should be obtained from the applicable author or publisher of the image. Full text @ Curr. Biol.