
|
Figure 5
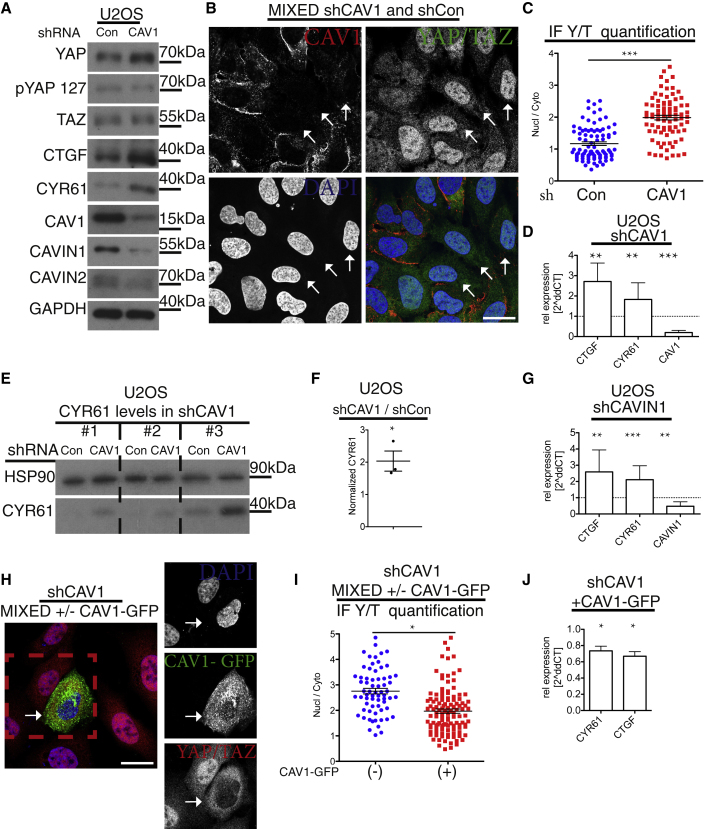
CAV1 Is a Negative Regulator of YAP/TAZ
(A) Western blot analysis of shRNA-induced
(B) Confocal image of mixed cell population of shCAV1 and shCon cells labeled for YAP/TAZ (green), CAV1 (red), and DAPI (blue;
(C) Dot plots of quantification of nuclear-to-cytoplasmic ratio of YAP/TAZ from images as in (B). Each dot represents one cell. Means ± SEM.
(D) qPCR analysis of shCAV1 cells. Means ± SD.
(E) Western blots from U2OS shCon and shCAV1 cell lysates from three independent experiments (nos. 1–3).
(F) Quantification from blots in (E) of normalized CYR61 values in U2OS shCAV1 cells compared to shCon cells. Student’s t test. Means ± SEM; shCAV1 cells have higher levels of CYR61 than control cells.
(G) qPCR analysis of shCAVIN1 U2OS cells compared to control. Means ± SD.
(H) Confocal image of mixed cell population of shCAV1 (empty vector) and shCAV1 (CAV1-GFP re-expressor) cells, labeled for YAP/TAZ (red), GFP (green), and DAPI (blue). Re-expression of CAV1 in shCAV1 cells rescues hyperactivation of YAP (related to
(I) Dot plot of quantification of nuclear-to-cytoplasmic ratio of YAP/TAZ from images as in (E). Each dot represents one cell. Means ± SEM.
(J) qPCR analysis of CAV1-GFP-expressing shCAV1 cell line compared to control shCAV1. Means ± SD.
Further related to this figure are